HSBC 2014 Annual Report Download - page 80
Download and view the complete annual report
Please find page 80 of the 2014 HSBC annual report below. You can navigate through the pages in the report by either clicking on the pages listed below, or by using the keyword search tool below to find specific information within the annual report.-
 1
1 -
2
-
3
-
4
-
5
-
6
-
7
-
8
-
9
-
10
-
11
-
12
-
13
-
14
-
15
-
16
-
17
-
18
-
19
-
20
-
21
-
22
-
23
-
24
-
25
-
26
-
27
-
28
-
29
-
30
-
31
-
32
-
33
-
34
-
35
-
36
-
37
-
38
-
39
-
40
-
41
-
42
-
43
-
44
-
45
-
46
-
47
-
48
-
49
-
50
-
51
-
52
-
53
-
54
-
55
-
56
-
57
-
58
-
59
-
60
-
61
-
62
-
63
-
64
-
65
-
66
-
67
-
68
-
69
-
 70
70 -
 71
71 -
 72
72 -
 73
73 -
 74
74 -
 75
75 -
 76
76 -
 77
77 -
 78
78 -
 79
79 -
 80
80 -
 81
81 -
 82
82 -
 83
83 -
 84
84 -
 85
85 -
 86
86 -
 87
87 -
 88
88 -
 89
89 -
 90
90 -
91
-
92
-
93
-
94
-
95
-
96
-
97
-
98
-
99
-
100
-
101
-
102
-
103
-
104
-
105
-
106
-
107
-
108
-
109
-
110
-
111
-
112
-
113
-
114
-
115
-
116
-
117
-
118
-
119
-
120
-
121
-
122
-
123
-
124
-
125
-
126
-
127
-
128
-
129
-
130
-
131
-
132
-
133
-
134
-
135
-
136
-
137
-
138
-
139
-
140
-
141
-
142
-
143
-
144
-
145
-
146
-
147
-
148
-
149
-
150
-
151
-
152
-
153
-
154
-
155
-
156
-
157
-
158
-
159
-
160
-
161
-
162
-
163
-
164
-
165
-
166
-
167
-
168
-
169
-
170
-
171
-
172
-
173
-
174
-
175
-
176
-
177
-
178
-
179
-
180
-
181
-
182
-
183
-
184
-
185
-
186
-
187
-
188
-
189
-
190
-
191
-
192
-
193
-
194
-
195
-
196
-
197
-
198
-
199
-
200
 |
 |

HSBC BANK PLC
Report of the Directors: Risk (continued)
78
The overall risk profile of our life insurance
manufacturing businesses did not change materially
during 2014, however, a notable change arose in the UK
where HSBC Life (UK) Ltd entered into an agreement to
sell its Pensions business. The transfer is subject to
regulatory approvals and is expected to complete in the
second half of 2015. HSBC has also entered into a
reinsurance agreement with the purchaser transferring
certain economic risks and rewards of the business until
completion of the transaction. A day-one gain of
£25 million was recognised on entering into this
reinsurance and the assets and liabilities have been
reclassified as held-for-sale.
During 2014 the Irish insurance entity HSBC Life (Europe)
Limited’s portfolio of insurance policies has been
transferred to HSBC Life Assurance (Malta) Limited.
Financial risks of insurance operations
The group’s insurance businesses are exposed to a range
of financial risks which can be categorised into:
• Market risk – risks arising from changes in the fair
values of financial assets or their future cash flows
from fluctuations in variables such as interest rates,
foreign exchange rates and equity prices;
• Credit risk – risk of financial loss following the default
of third parties to meet their obligations; and
• Liquidity risk – risk of not being able to make
payments to policyholders as they fall due as a result
of insufficient assets that can be realised as cash.
Local regulatory requirements prescribe the type, quality
and concentration of assets that the group’s insurance
manufacturing companies must maintain to meet
insurance liabilities. These requirements complement
Group-wide policies.
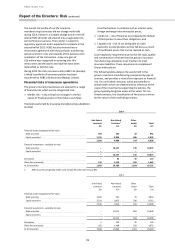
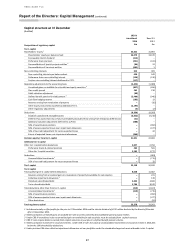
The following table analyses the assets held in the
group’s insurance manufacturing companies by type of
contract, and provides a view of the exposure to financial
risk. For unit-linked contracts, which pay benefits to
policyholders which are determined by reference to the
value of the investments supporting the policies, the
group typically designate assets at fair value; for non-
linked contracts, the classification of the assets is driven
by the nature of the underlying contract.
Financial assets held by insurance manufacturing subsidiaries
(Audited)
2014
Unit-linked
contracts
Non-linked
Contracts1
Other
assets
Total
£m
£m
£m
£m
Financial assets designated at fair value
Debt securities
369
554
28
951
Equity securities
1,315
3,854
686
5,855
1,684
4,408
714
6,806
Financial investments
- available-for-sale
Debt securities
–
10,157
716
10,873
Equity securities
–
–
–
–
–
10,157
716
10,873
Derivatives
–
65
45
110
Other financial assets
215
1,538
209
1,962
At 31 December
1,899
16,168
1,684
19,751
1 Debt securities designated at fair value include £3 million of Treasury Bills.
2013
Unit-linked
contracts
Non-linked
contracts
Other
assets
Total
£m
£m
£m
£m
Financial assets designated at fair value
Debt securities
2,265
544
25
2,834
Equity securities
5,311
3,871
530
9,712
7,576
4,415
555
12,546
Financial investments - available-for-sale
Debt securities
–
10,113
823
10,936
Equity securities
–
–
–
–
–
10,113
823
10,936
Derivatives
5
130
30
165
Other financial assets
262
1,408
203
1,873
At 31 December
7,843
16,066
1,611
25,520