HSBC 2014 Annual Report Download - page 56
Download and view the complete annual report
Please find page 56 of the 2014 HSBC annual report below. You can navigate through the pages in the report by either clicking on the pages listed below, or by using the keyword search tool below to find specific information within the annual report.-
 1
1 -
2
-
3
-
4
-
5
-
6
-
7
-
8
-
9
-
10
-
11
-
12
-
13
-
14
-
15
-
16
-
17
-
18
-
19
-
20
-
21
-
22
-
23
-
24
-
25
-
26
-
27
-
28
-
29
-
30
-
31
-
32
-
33
-
34
-
35
-
36
-
37
-
38
-
39
-
40
-
41
-
42
-
43
-
44
-
45
-
 46
46 -
 47
47 -
 48
48 -
 49
49 -
 50
50 -
 51
51 -
 52
52 -
 53
53 -
 54
54 -
 55
55 -
 56
56 -
 57
57 -
 58
58 -
 59
59 -
 60
60 -
 61
61 -
 62
62 -
 63
63 -
 64
64 -
 65
65 -
 66
66 -
67
-
68
-
69
-
70
-
71
-
72
-
73
-
74
-
75
-
76
-
77
-
78
-
79
-
80
-
81
-
82
-
83
-
84
-
85
-
86
-
87
-
88
-
89
-
90
-
91
-
92
-
93
-
94
-
95
-
96
-
97
-
98
-
99
-
100
-
101
-
102
-
103
-
104
-
105
-
106
-
107
-
108
-
109
-
110
-
111
-
112
-
113
-
114
-
115
-
116
-
117
-
118
-
119
-
120
-
121
-
122
-
123
-
124
-
125
-
126
-
127
-
128
-
129
-
130
-
131
-
132
-
133
-
134
-
135
-
136
-
137
-
138
-
139
-
140
-
141
-
142
-
143
-
144
-
145
-
146
-
147
-
148
-
149
-
150
-
151
-
152
-
153
-
154
-
155
-
156
-
157
-
158
-
159
-
160
-
161
-
162
-
163
-
164
-
165
-
166
-
167
-
168
-
169
-
170
-
171
-
172
-
173
-
174
-
175
-
176
-
177
-
178
-
179
-
180
-
181
-
182
-
183
-
184
-
185
-
186
-
187
-
188
-
189
-
190
-
191
-
192
-
193
-
194
-
195
-
196
-
197
-
198
-
199
-
200
 |
 |

HSBC BANK PLC
Report of the Directors: Risk (continued)
54
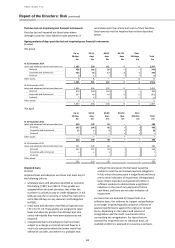
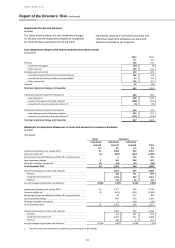
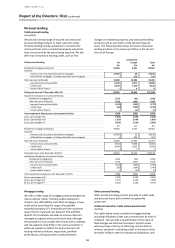
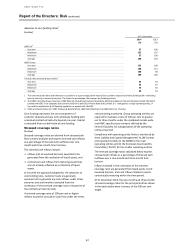
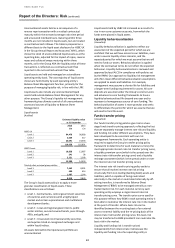
Commercial real estate loans and advances including loan commitments by level of collateral
(Audited)
2014
2013
£m
£m
Rated CRR1 1 to 7
Not collateralised
3,433
2,943
Fully collateralised
16,414
14,418
Partially collateralised
888
1,611
- collateral value
662
1,105
20,735
18,972
Rated CRR1 8 to 10
Not collateralised
260
408
Fully collateralised
1,001
1,132
LTV ratio less than 50%
91
250
- 51% to 75%
522
485
- 76% to 90%
193
232
- 90% to 100%
195
165
Partially collateralised
929
1,315
- collateral value
616
947
2,190
2,855
Total at 31 December
22,925
21,827
1 Customer risk rating (‘CRR’). See page 43 for further information.
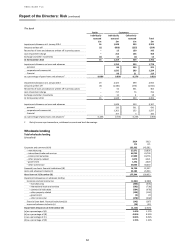
Other corporate, commercial and financial (non-bank)
Other Corporate, commercial and financial (non-bank) is
analysed separately below reflecting the difference in
collateral held on the portfolios. For financing activities
in corporate and commercial lending that are not
predominantly commercial real estate-oriented,
collateral value is not strongly correlated to principal
repayment performance. Collateral values are generally
refreshed when an obligor’s general credit performance
deteriorates and we have to assess the likely
performance of secondary sources of repayment should
it prove necessary to rely on them.
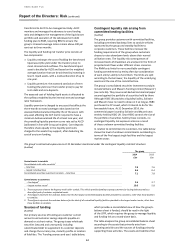
The following table shows corporate, commercial and
financial (non-bank) lending including off balance sheet
loan commitments by level of collateralisation.
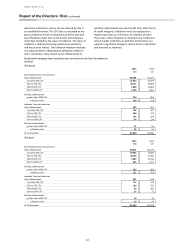
Other corporate, commercial and financial (non-bank) loans and advances including loan commitments by level of
collateral rated CRR/EL 8 to 10 only
(Audited)
2014
2013
£m
£m
Not collateralised
4,001
3,397
Fully collateralised
797
473
- LTV ratio less than 50%
184
101
- 51% to 75%
275
158
- 76% to 90%
140
108
- 90% to 100%
198
106
Partially collateralised
468
819
- collateral value
249
415
Total at 31 December
5,266
4,689
Loans and advances to banks
(Audited)
The following table shows loans and advances to banks
including off-balance sheet loan commitments by level of
collateral. The collateral used in the assessment relates
primarily to cash and marketable securities. This analysis
excludes reverse repo balances.
Loans and advances to banks including loan commitments by level of collateral
(Audited)
2014
2013
£m
£m
Not collateralised
25,607
21,928
Fully collateralised
67
1,499
Partially collateralised
3
41
- collateral value
2
2
Total at 31 December
25,677
23,468