HSBC 2014 Annual Report Download - page 15
Download and view the complete annual report
Please find page 15 of the 2014 HSBC annual report below. You can navigate through the pages in the report by either clicking on the pages listed below, or by using the keyword search tool below to find specific information within the annual report.-
 1
1 -
2
-
3
-
4
-
 5
5 -
 6
6 -
 7
7 -
 8
8 -
 9
9 -
 10
10 -
 11
11 -
 12
12 -
 13
13 -
 14
14 -
 15
15 -
 16
16 -
 17
17 -
 18
18 -
 19
19 -
 20
20 -
 21
21 -
 22
22 -
 23
23 -
 24
24 -
 25
25 -
26
-
27
-
28
-
29
-
30
-
31
-
32
-
33
-
34
-
35
-
36
-
37
-
38
-
39
-
40
-
41
-
42
-
43
-
44
-
45
-
46
-
47
-
48
-
49
-
50
-
51
-
52
-
53
-
54
-
55
-
56
-
57
-
58
-
59
-
60
-
61
-
62
-
63
-
64
-
65
-
66
-
67
-
68
-
69
-
70
-
71
-
72
-
73
-
74
-
75
-
76
-
77
-
78
-
79
-
80
-
81
-
82
-
83
-
84
-
85
-
86
-
87
-
88
-
89
-
90
-
91
-
92
-
93
-
94
-
95
-
96
-
97
-
98
-
99
-
100
-
101
-
102
-
103
-
104
-
105
-
106
-
107
-
108
-
109
-
110
-
111
-
112
-
113
-
114
-
115
-
116
-
117
-
118
-
119
-
120
-
121
-
122
-
123
-
124
-
125
-
126
-
127
-
128
-
129
-
130
-
131
-
132
-
133
-
134
-
135
-
136
-
137
-
138
-
139
-
140
-
141
-
142
-
143
-
144
-
145
-
146
-
147
-
148
-
149
-
150
-
151
-
152
-
153
-
154
-
155
-
156
-
157
-
158
-
159
-
160
-
161
-
162
-
163
-
164
-
165
-
166
-
167
-
168
-
169
-
170
-
171
-
172
-
173
-
174
-
175
-
176
-
177
-
178
-
179
-
180
-
181
-
182
-
183
-
184
-
185
-
186
-
187
-
188
-
189
-
190
-
191
-
192
-
193
-
194
-
195
-
196
-
197
-
198
-
199
-
200
 |
 |

HSBC BANK PLC
Strategic Report: Business Review
13
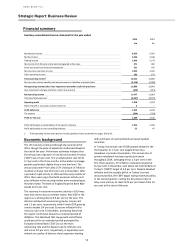
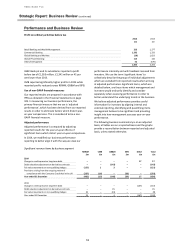
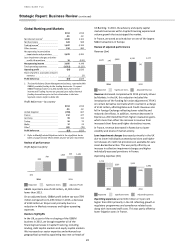
Financial summary
Summary consolidated income statement for the year ended
2014
2013
£m
£m
Net interest income
6,629
6,961
Net fee income
3,266
3,336
Trading income
1,609
2,373
Net income from financial instruments designated at fair value
371
900
Gains less losses from financial investments
321
100
Net insurance premium income
1,823
2,022
Other operating income
183
176
Total operating income
1
14,202
15,868
Net insurance claims, benefits paid and movement in liabilities to policyholders
(2,316)
(3,028)
Net operating income before loan impairment and other credit risk provisions
11,886
12,840
Loan impairment charges and other credit risk provisions
(449)
(971)
Net operating income
11,437
11,869
Total operating expenses
1
(9,487)
(8,575)
Operating profit
1,950
3,294
Share of profit in associates and joint ventures
3
–
Profit before tax
1,953
3,294
Tax expense
(564)
(754)
Profit for the year
1,389
2,540
Profit attributable to shareholders of the parent company
1,354
2,495
Profit attributable to non-controlling interests
35
45
1 Total operating income and expenses include significant items as detailed on pages 18 and 19.
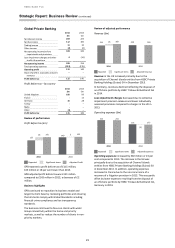
Economic background
The UK recovery continued through the second half of
2014, though the pace of expansion moderated towards
the end of the year. Preliminary estimates indicate that
the annual rate of growth of real Gross Domestic Product
(‘GDP’) was 2.6 per cent. The unemployment rate fell to
5.7 per cent in the three months to December and wage
growth accelerated slightly from a very low level. The
annual Consumer Price Index (‘CPI’) measure of inflation
reached a 14-year low of 0.5 per cent in December. After
a period of rapid activity in 2013 and the early months of
2014, there were signs that both economic activity and
price inflation in the housing market were moderating as
the year ended. The Bank of England kept the Bank Rate
steady at 0.5 per cent.
The recovery in eurozone economic activity in 2014 was
slow and uneven across member states. Real GDP in the
region as a whole grew by 0.9 per cent in the year. The
German and Spanish economies grew by 1.6 per cent
and 1.5 per cent, respectively, while French GDP grew by
a more modest 0.4 per cent. Eurozone inflation fell to
minus 0.2 per cent in December, prompting fears that
the region could move towards a sustained period of
deflation. The likelihood that low growth and inflation
could persist for an extended period prompted the
European Central Bank (‘ECB’) to cut the main
refinancing rate and the deposit rate to 0.05 per cent
and minus 0.2 per cent, respectively, in September and
embark on a policy of balance sheet expansion starting
with purchases of covered bonds and asset-backed
securities.
In Turkey, the annual rate of GDP growth slowed in the
third quarter to 1.7 per cent largely driven by a
slowdown in private consumption. The annual rate of
private investment has been particularly weak
throughout 2014, averaging minus 1.6 per cent in the
first three quarters. CPI inflation remained elevated at
8.2 per cent in December, well above the Central Bank of
Turkey's (‘CBRT’) target of 5.0 per cent. Despite elevated
inflation and the sizeable deficit in Turkey’s current
account position, the CBRT began easing monetary policy
in the second quarter, cutting the key interest rate in
May, June and July to reach 8.25 per cent down from 10
per cent at the start of the year.