HSBC 2014 Annual Report Download - page 73
Download and view the complete annual report
Please find page 73 of the 2014 HSBC annual report below. You can navigate through the pages in the report by either clicking on the pages listed below, or by using the keyword search tool below to find specific information within the annual report.-
 1
1 -
2
-
3
-
4
-
5
-
6
-
7
-
8
-
9
-
10
-
11
-
12
-
13
-
14
-
15
-
16
-
17
-
18
-
19
-
20
-
21
-
22
-
23
-
24
-
25
-
26
-
27
-
28
-
29
-
30
-
31
-
32
-
33
-
34
-
35
-
36
-
37
-
38
-
39
-
40
-
41
-
42
-
43
-
44
-
45
-
46
-
47
-
48
-
49
-
50
-
51
-
52
-
53
-
54
-
55
-
56
-
57
-
58
-
59
-
60
-
61
-
62
-
 63
63 -
 64
64 -
 65
65 -
 66
66 -
 67
67 -
 68
68 -
 69
69 -
 70
70 -
 71
71 -
 72
72 -
 73
73 -
 74
74 -
 75
75 -
 76
76 -
 77
77 -
 78
78 -
 79
79 -
 80
80 -
 81
81 -
 82
82 -
 83
83 -
84
-
85
-
86
-
87
-
88
-
89
-
90
-
91
-
92
-
93
-
94
-
95
-
96
-
97
-
98
-
99
-
100
-
101
-
102
-
103
-
104
-
105
-
106
-
107
-
108
-
109
-
110
-
111
-
112
-
113
-
114
-
115
-
116
-
117
-
118
-
119
-
120
-
121
-
122
-
123
-
124
-
125
-
126
-
127
-
128
-
129
-
130
-
131
-
132
-
133
-
134
-
135
-
136
-
137
-
138
-
139
-
140
-
141
-
142
-
143
-
144
-
145
-
146
-
147
-
148
-
149
-
150
-
151
-
152
-
153
-
154
-
155
-
156
-
157
-
158
-
159
-
160
-
161
-
162
-
163
-
164
-
165
-
166
-
167
-
168
-
169
-
170
-
171
-
172
-
173
-
174
-
175
-
176
-
177
-
178
-
179
-
180
-
181
-
182
-
183
-
184
-
185
-
186
-
187
-
188
-
189
-
190
-
191
-
192
-
193
-
194
-
195
-
196
-
197
-
198
-
199
-
200
 |
 |
HSBC BANK PLC
Report of the Directors: Risk (continued)
71
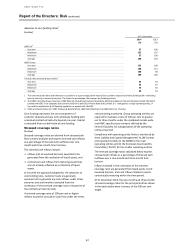
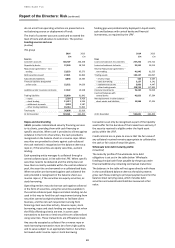
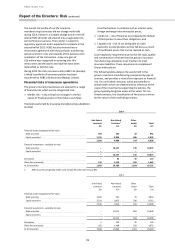
Non-trading portfolios
(Audited)
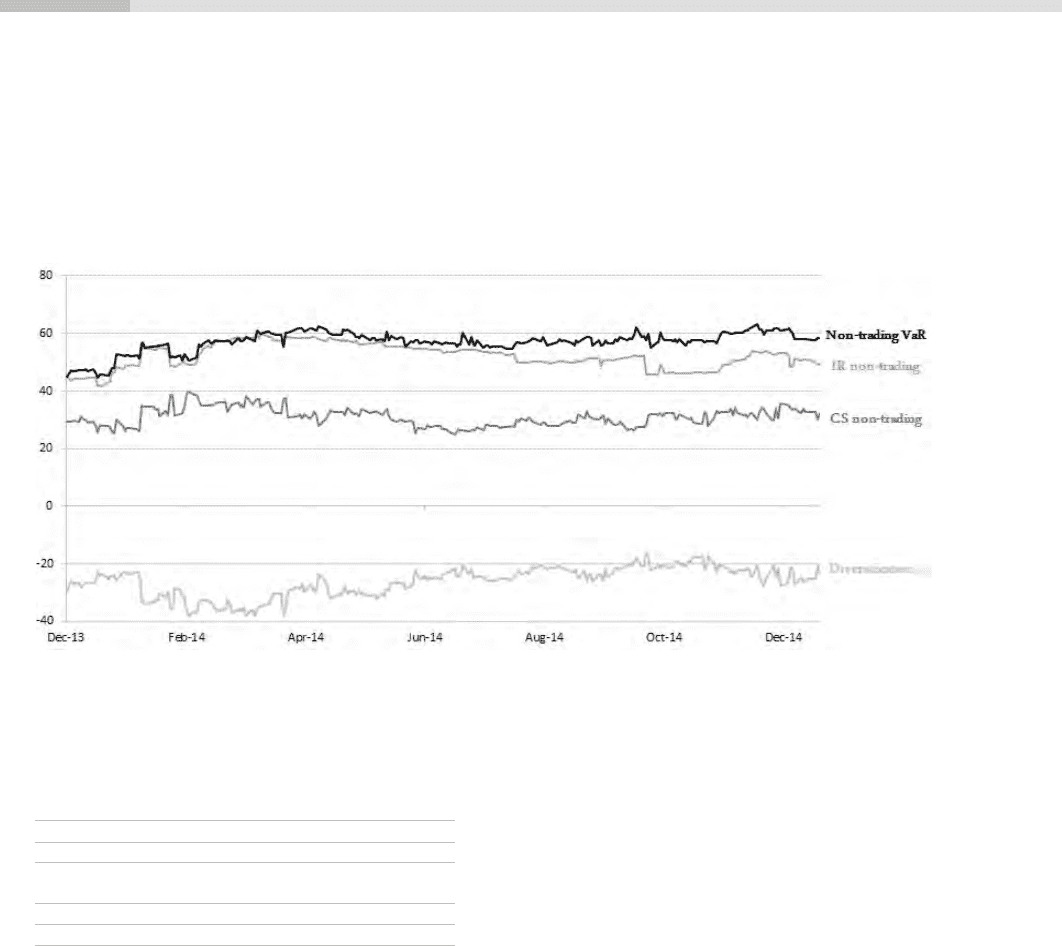
Value at Risk of the non-trading portfolios
Non-trading VaR of the group includes contributions
from all global businesses. There is no commodity risk in
the non-trading portfolios. The non-trading VAR was
higher at 31 December 2014 compared to 31 December
2013 primarily due to increases in interest rate and
credit VaR, together with a lower portfolio diversification
benefit across asset classes.
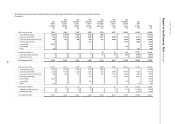
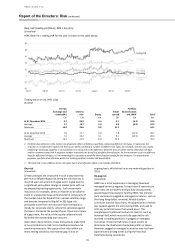
Daily VaR (non-trading portfolios), 99% 1 day (£m)
(Unaudited)
HSBC Bank Plc’s non-trading VaR for the year is shown in the table below.
Non-trading value at risk, 99% 1 day
(Audited)
Interest
rate
Credit
spread
Portfolio
diversification
Total
£m
£m
£m
£m
At 31 December 2014
49.5
32.4
(23.5)
58.4
Average
52.2
31.0
(26.2)
57.0
Maximum
60.1
39.6
63.1
At 31 December 2013
44.8
29.4
(29.4)
44.8
Average
41.6
41.3
(28.5)
54.4
Maximum
63.2
52.6
65.4
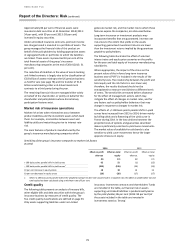
Non-trading VaR also includes the interest rate risk of
non-trading financial instruments held by the global
businesses and transferred into portfolios managed by
BSM or local treasury functions. In measuring,
monitoring and managing risk in our non-trading
portfolios, VaR is just one of the tools used. The
management of interest rate risk in the banking book is
described further in ‘Non-trading interest rate risk’
below, including the role of BSM.
Non-trading VaR excludes equity risk on available-for-
sale securities, structural foreign exchange risk, and
interest rate risk on fixed rate securities issued by the
group, the scope and management of which are
described in the relevant sections below.
The group’s control of market risk in the non-trading
portfolios is based on transferring the assessed market
risk of non-trading assets and liabilities created outside
BSM or Markets, to the books managed by BSM,
provided the market risk can be neutralised. The net
exposure is typically managed by BSM through the use of
fixed rate government bonds (liquid asset held in
available for sale books) and interest rate swaps. The
interest rate risk arising from fixed rate government
bonds held within available for sale portfolios is reflected
within the group’s non-traded VaR. Interest rate swaps
used by BSM are typically classified as either a fair value
hedge or a cash flow hedge and included within the
group’s non-traded VaR. Any market risk that cannot be
neutralised in the market is managed by local ALCO in
segregated ALCO books.
The funds transfer pricing policies give rise to a two stage
funds transfer pricing approach. For details see page 63.
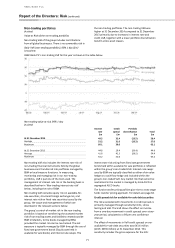
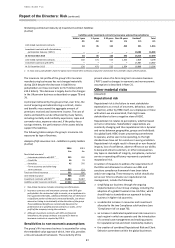
Credit spread risk for available-for-sale debt securities
The risk associated with movements in credit spreads is
primarily managed through sensitivity limits, stress
testing and VaR. The VaR shows the effect on income
from a one-day movement in credit spreads over a two-
year period, calculated to a 99 per cent confidence
interval.
The effect of movements in VaR credit spreads on our
available-for-sale debt securities was £43.6 million
(2013: £49.8 million) at 31 December 2014. This
sensitivity includes the gross exposure for the SICs