HSBC 2014 Annual Report Download - page 157
Download and view the complete annual report
Please find page 157 of the 2014 HSBC annual report below. You can navigate through the pages in the report by either clicking on the pages listed below, or by using the keyword search tool below to find specific information within the annual report.-
 1
1 -
2
-
3
-
4
-
5
-
6
-
7
-
8
-
9
-
10
-
11
-
12
-
13
-
14
-
15
-
16
-
17
-
18
-
19
-
20
-
21
-
22
-
23
-
24
-
25
-
26
-
27
-
28
-
29
-
30
-
31
-
32
-
33
-
34
-
35
-
36
-
37
-
38
-
39
-
40
-
41
-
42
-
43
-
44
-
45
-
46
-
47
-
48
-
49
-
50
-
51
-
52
-
53
-
54
-
55
-
56
-
57
-
58
-
59
-
60
-
61
-
62
-
63
-
64
-
65
-
66
-
67
-
68
-
69
-
70
-
71
-
72
-
73
-
74
-
75
-
76
-
77
-
78
-
79
-
80
-
81
-
82
-
83
-
84
-
85
-
86
-
87
-
88
-
89
-
90
-
91
-
92
-
93
-
94
-
95
-
96
-
97
-
98
-
99
-
100
-
101
-
102
-
103
-
104
-
105
-
106
-
107
-
108
-
109
-
110
-
111
-
112
-
113
-
114
-
115
-
116
-
117
-
118
-
119
-
120
-
121
-
122
-
123
-
124
-
125
-
126
-
127
-
128
-
129
-
130
-
131
-
132
-
133
-
134
-
135
-
136
-
137
-
138
-
139
-
140
-
141
-
142
-
143
-
144
-
145
-
146
-
 147
147 -
 148
148 -
 149
149 -
 150
150 -
 151
151 -
 152
152 -
 153
153 -
 154
154 -
 155
155 -
 156
156 -
 157
157 -
 158
158 -
 159
159 -
 160
160 -
 161
161 -
 162
162 -
 163
163 -
 164
164 -
 165
165 -
 166
166 -
 167
167 -
168
-
169
-
170
-
171
-
172
-
173
-
174
-
175
-
176
-
177
-
178
-
179
-
180
-
181
-
182
-
183
-
184
-
185
-
186
-
187
-
188
-
189
-
190
-
191
-
192
-
193
-
194
-
195
-
196
-
197
-
198
-
199
-
200
 |
 |
HSBC BANK PLC
Notes on the Financial Statements (continued)
155
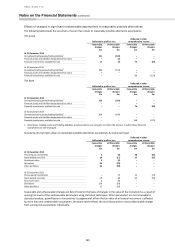
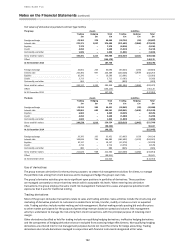
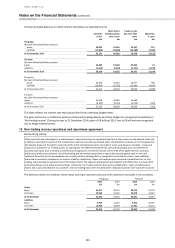
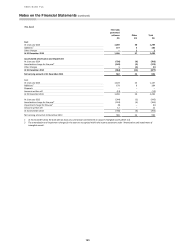
Forecast principal balances on which interest cash flows are expected to arise
3 months
or less
More than 3
months but less
than 1 year
5 years or less
but more than
1 year
More than
5 years
£m
£m
£m
£m
The group
Net cash inflows/(outflows) exposure
Assets
59,995
54,091
33,947
251
Liabilities
(17,824)
(13,609)
(10,388)
(3,380)
At 31 December 2014
42,171
40,482
23,559
(3,129)
The bank
Net cash inflows/(outflows) exposure
Assets
44,485
44,458
30,842
41
Liabilities
(5,315)
(5,226)
(4,741)
(1,235)
At 31 December 2014
39,170
39,232
26,101
(1,194)
The group
Net cash inflows/(outflows) exposure
Assets
64,230
56,681
38,577
909
Liabilities
(19,893)
(12,262)
(10,481)
(4,807)
At 31 December 2013
44,337
44,419
28,096
(3,898)
The bank
Net cash inflows/(outflows) exposure
Assets
43,498
42,862
34,489
–
Liabilities
(6,343)
(6,223)
(4,539)
(322)
At 31 December 2013
37,155
36,639
29,950
(322)
This table reflects the interest rate repricing profile of the underlying hedged items.
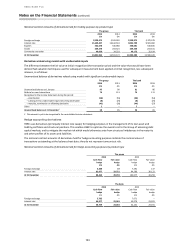
The gains and losses on ineffective portions of derivatives designated as cash flow hedges are recognised immediately in
‘Net trading income’. During the year to 31 December 2014 a gain of £8 million (2013: loss of £8 million) was recognised
due to hedge ineffectiveness.
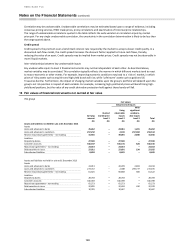
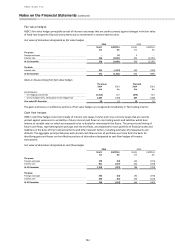
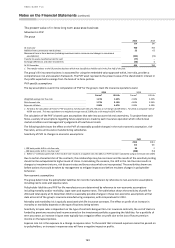
16 Non-trading reverse repurchase and repurchase agreement
Accounting policy
When securities are sold subject to a commitment to repurchase them at a predetermined price, they remain on the balance sheet and
a liability is recorded in respect of the consideration received. Securities purchased under commitments to resale are not recognised on
the balance sheet and the right to receive back the initial consideration paid is recorded in ‘Loans and advances to banks’, ‘Loans and
advances to customers’ or ‘Trading assets’ as appropriate. The difference between the sale and repurchase price or between the
purchase and resale price is treated as interest and recognised in net interest income over the life of the agreement for loans and
advances to banks and customers. Securities lending and borrowing transactions are generally secured against cash or non-cash
collateral. Securities lent or borrowed do not normally result in derecognition or recognition on the balance sheet. Cash collateral
advanced or received is recorded as an asset or a liability respectively. Repos and reverse repos measured at amortised cost, or non-
trading, are presented as separate lines in the balance sheet. This separate presentation was adopted with effect from 1 January 2014
and comparatives are re-presented accordingly. Previously, non-trading reverse repos were included within ‘Loans and advances to
banks’ and ‘Loans and advances to customers’ and non-trading repos were included within ‘Deposits by banks’ and ‘Customer accounts’.
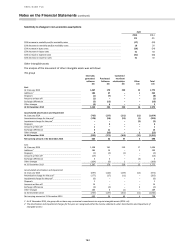
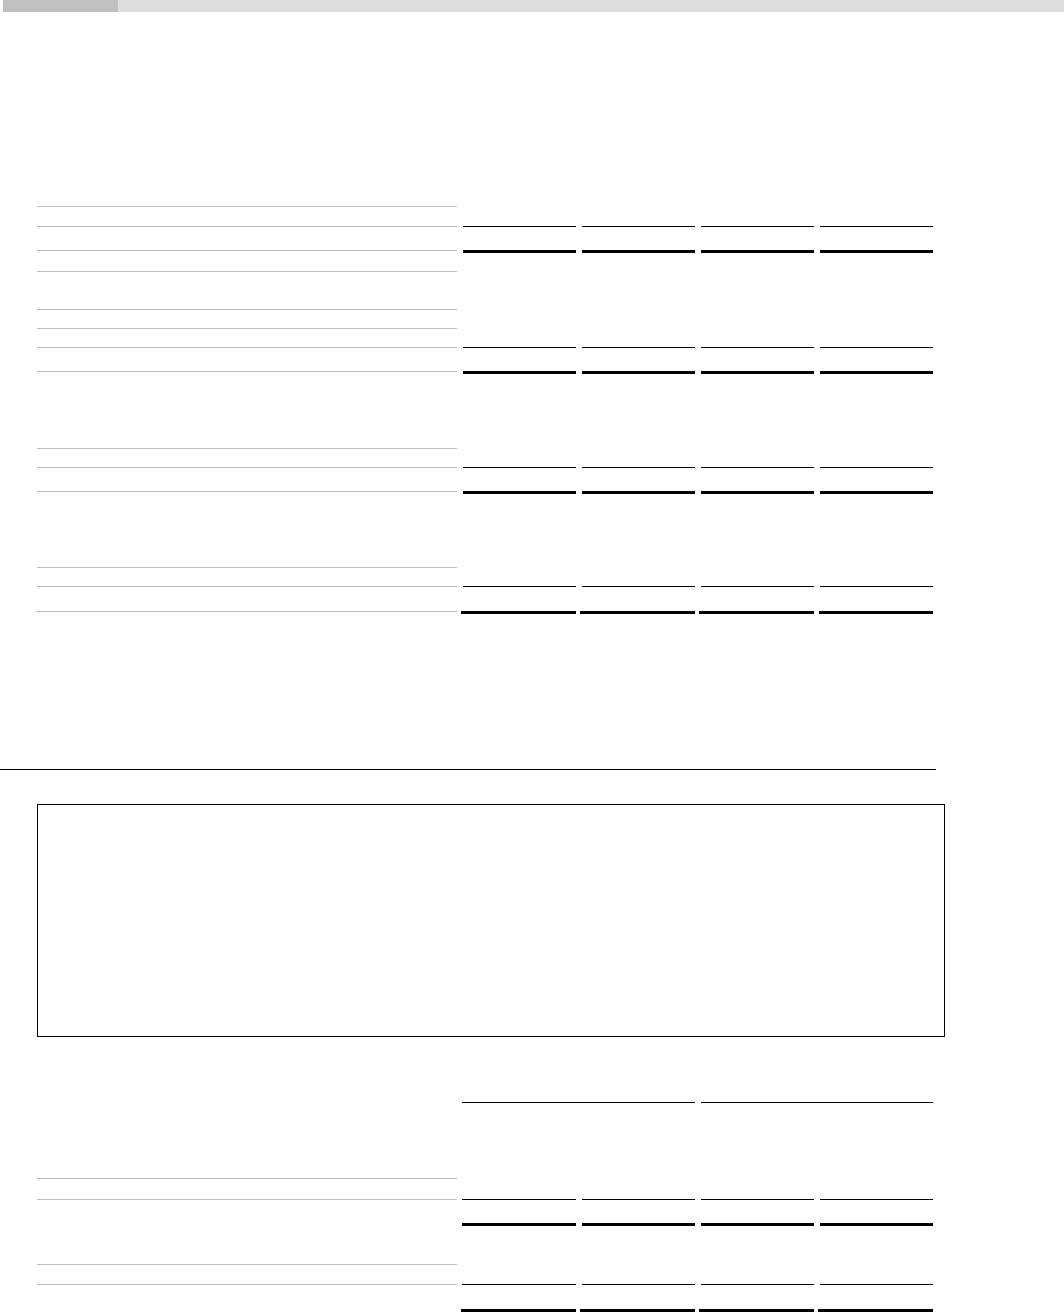
The extent to which non-trading reverse repos and repos represent amounts with customers and banks is set out below.
The group
The bank
2014
2013
2014
2013
£m
£m
£m
£m
Assets
Banks
22,477
30,215
20,713
25,234
Customers
19,468
31,310
15,678
22,613
At 31 December
41,945
61,525
36,391
47,847
Liabilities
Banks
9,793
21,914
6,302
20,057
Customers
13,560
43,659
11,991
31,141
At 31 December
23,353
65,573
18,293
51,198