HSBC 2014 Annual Report Download - page 42
Download and view the complete annual report
Please find page 42 of the 2014 HSBC annual report below. You can navigate through the pages in the report by either clicking on the pages listed below, or by using the keyword search tool below to find specific information within the annual report.-
 1
1 -
2
-
3
-
4
-
5
-
6
-
7
-
8
-
9
-
10
-
11
-
12
-
13
-
14
-
15
-
16
-
17
-
18
-
19
-
20
-
21
-
22
-
23
-
24
-
25
-
26
-
27
-
28
-
29
-
30
-
31
-
 32
32 -
 33
33 -
 34
34 -
 35
35 -
 36
36 -
 37
37 -
 38
38 -
 39
39 -
 40
40 -
 41
41 -
 42
42 -
 43
43 -
 44
44 -
 45
45 -
 46
46 -
 47
47 -
 48
48 -
 49
49 -
 50
50 -
 51
51 -
 52
52 -
53
-
54
-
55
-
56
-
57
-
58
-
59
-
60
-
61
-
62
-
63
-
64
-
65
-
66
-
67
-
68
-
69
-
70
-
71
-
72
-
73
-
74
-
75
-
76
-
77
-
78
-
79
-
80
-
81
-
82
-
83
-
84
-
85
-
86
-
87
-
88
-
89
-
90
-
91
-
92
-
93
-
94
-
95
-
96
-
97
-
98
-
99
-
100
-
101
-
102
-
103
-
104
-
105
-
106
-
107
-
108
-
109
-
110
-
111
-
112
-
113
-
114
-
115
-
116
-
117
-
118
-
119
-
120
-
121
-
122
-
123
-
124
-
125
-
126
-
127
-
128
-
129
-
130
-
131
-
132
-
133
-
134
-
135
-
136
-
137
-
138
-
139
-
140
-
141
-
142
-
143
-
144
-
145
-
146
-
147
-
148
-
149
-
150
-
151
-
152
-
153
-
154
-
155
-
156
-
157
-
158
-
159
-
160
-
161
-
162
-
163
-
164
-
165
-
166
-
167
-
168
-
169
-
170
-
171
-
172
-
173
-
174
-
175
-
176
-
177
-
178
-
179
-
180
-
181
-
182
-
183
-
184
-
185
-
186
-
187
-
188
-
189
-
190
-
191
-
192
-
193
-
194
-
195
-
196
-
197
-
198
-
199
-
200
 |
 |

HSBC BANK PLC
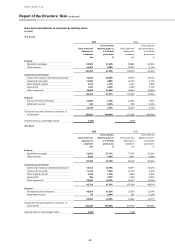
Report of the Directors: Risk (continued)
40
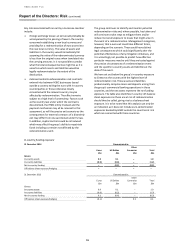
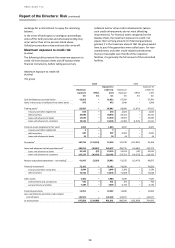
Maximum exposure to credit risk
(Audited)
The bank
2014
2013
Maximum
exposure
Offset
Exposure to
credit risk
(net)
Maximum
exposure
Offset
Exposure to
credit risk
(net)
£m
£m
£m
£m
£m
£m
Cash and balances at central banks
41,424
–
41,424
60,996
–
60,996
Items in the course of collection from other banks
630
–
630
1,374
–
1,374
Trading assets1
55,858
–
55,858
66,865
(1,075)
65,790
treasury and other eligible bills
154
–
154
643
–
643
debt securities
25,150
–
25,150
28,821
–
28,821
loans and advances to banks
13,039
–
13,039
16,568
–
16,568
loans and advances to customers
17,515
–
17,515
20,833
(1,075)
19,758
Financial assets designated at fair value1
9
–
9
3,983
–
3,983
debt securities
9
–
9
3,983
–
3,983
loans and advances to banks
–
–
–
–
–
–
Derivatives2
160,232
(136,187)
24,045
112,623
(77,990)
34,633
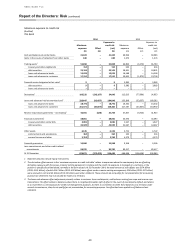
Loans and advances held at amortised cost3
220,447
(35,607)
184,840
233,899
(53,637)
180,262
loans and advances to banks
18,776
–
18,776
16,332
–
16,332
loans and advances to customers
201,671
(35,607)
166,064
217,567
(53,637)
163,930
Reverse repurchase agreements – non-trading3
36,391
(628)
35,763
47,847
(5,924)
41,923
Financial investments1
48,001
–
48,001
44,594
–
44,594
treasury and other similar bills
2,081
–
2,081
1,927
–
1,927
debt securities
45,920
–
45,920
42,667
–
42,667
Other assets
6,126
–
6,126
4,722
–
4,722
endorsements and acceptances
364
–
364
343
–
343
accrued income and other
5,762
–
5,762
4,379
–
4,379
Financial guarantees
10,968
–
10,968
9,366
–
9,366
Loan commitments and other credit-related
commitments
96,785
–
96,785
80,417
–
80,417
At 31 December
676,871
(172,422)
504,449
666,686
(138,626)
528,060
1 Reported amounts exclude equity instruments.
2 The derivative offset amount in the ‘maximum exposure to credit risk table’ relates to exposures where the counterparty has an offsetting
derivative exposure with the group, a master netting agreement is in place and the credit risk exposure is managed on a net basis, or the
position is specifically collateralised, normally in the form of cash. At 31 December 2014, the total amount of such offsets was £174 billion
(2013: £113 billion), of which £147 billion (2013: £93 billion) were offsets under a master netting arrangement, £24 billion (2013: £17 billion)
were received in cash and £3 billion (2013: £3 billion) were other collateral. These amounts do not qualify for net presentation for accounting
purposes as settlement may not actually be made on a net basis.
3 The loans and advances offset adjustment primarily relates to customer loans and deposits, and balances arising from repo and reverse repo
transactions. The offset relates to balances where there is a legally enforceable right of offset in the event of counterparty default, and where,
as a result there is a net exposure for credit risk management purposes. As there is no intention to settle these balances on a net basis under
normal circumstances, they do not qualify for net presentation for accounting purposes. No offset has been applied to off balance sheet
collateral.