HSBC 2014 Annual Report Download - page 75
Download and view the complete annual report
Please find page 75 of the 2014 HSBC annual report below. You can navigate through the pages in the report by either clicking on the pages listed below, or by using the keyword search tool below to find specific information within the annual report.-
 1
1 -
2
-
3
-
4
-
5
-
6
-
7
-
8
-
9
-
10
-
11
-
12
-
13
-
14
-
15
-
16
-
17
-
18
-
19
-
20
-
21
-
22
-
23
-
24
-
25
-
26
-
27
-
28
-
29
-
30
-
31
-
32
-
33
-
34
-
35
-
36
-
37
-
38
-
39
-
40
-
41
-
42
-
43
-
44
-
45
-
46
-
47
-
48
-
49
-
50
-
51
-
52
-
53
-
54
-
55
-
56
-
57
-
58
-
59
-
60
-
61
-
62
-
63
-
64
-
 65
65 -
 66
66 -
 67
67 -
 68
68 -
 69
69 -
 70
70 -
 71
71 -
 72
72 -
 73
73 -
 74
74 -
 75
75 -
 76
76 -
 77
77 -
 78
78 -
 79
79 -
 80
80 -
 81
81 -
 82
82 -
 83
83 -
 84
84 -
 85
85 -
86
-
87
-
88
-
89
-
90
-
91
-
92
-
93
-
94
-
95
-
96
-
97
-
98
-
99
-
100
-
101
-
102
-
103
-
104
-
105
-
106
-
107
-
108
-
109
-
110
-
111
-
112
-
113
-
114
-
115
-
116
-
117
-
118
-
119
-
120
-
121
-
122
-
123
-
124
-
125
-
126
-
127
-
128
-
129
-
130
-
131
-
132
-
133
-
134
-
135
-
136
-
137
-
138
-
139
-
140
-
141
-
142
-
143
-
144
-
145
-
146
-
147
-
148
-
149
-
150
-
151
-
152
-
153
-
154
-
155
-
156
-
157
-
158
-
159
-
160
-
161
-
162
-
163
-
164
-
165
-
166
-
167
-
168
-
169
-
170
-
171
-
172
-
173
-
174
-
175
-
176
-
177
-
178
-
179
-
180
-
181
-
182
-
183
-
184
-
185
-
186
-
187
-
188
-
189
-
190
-
191
-
192
-
193
-
194
-
195
-
196
-
197
-
198
-
199
-
200
 |
 |

HSBC BANK PLC
Report of the Directors: Risk (continued)
73
• the amount of the current balance that can be
assessed as ‘stable’ under business-as-usual
conditions; and
• for managed rate balances the historic market
interest rate re-pricing behaviour observed; or
• for non-interest bearing balances the duration for
which the balance is expected to remain under
business-as-usual conditions. This assessment is often
driven by the re-investment tenors available to BSM
to neutralise the risk through the use of fixed rate
government bonds or interest rate derivatives, and
for derivatives the availability of cash flow hedging
capacity.
Balance sheet management
Effective governance across BSM is supported by the
dual reporting lines it has to the CEO of GB&M and to
the Group Treasurer. In each operating entity, BSM is
responsible for managing liquidity and funding under the
supervision of the local ALCO. It also manages the non-
trading interest rate positions transferred to it within a
Global Markets limit structure.
In executing the management of the liquidity risk on
behalf of ALCO, and managing the non-trading interest
rate positions transferred to it, BSM invests in highly-
rated liquid assets in line with the Group’s liquid asset
policy. The majority of the liquidity is invested in central
bank deposits and government, supranational and
agency securities with most of the remainder held in
short-term interbank and central bank loans.
Withdrawable central bank deposits are accounted for as
cash balances. Interbank loans, statutory central bank
reserves and loans to central banks are accounted for as
loans and advances to banks. BSM’s holdings of
securities are accounted for as available-for-sale assets.
Statutory central bank reserves are not recognised as
liquid assets. The statutory reserves that would be
released in line with the Group’s stressed customer
deposit outflow assumptions are reflected as stressed
inflows.
BSM is permitted to use derivatives as part of
its mandate to manage interest rate risk. Derivative
activity is predominantly through the use of vanilla
interest rate swaps which are part of cash flow hedging
and fair value hedging relationships.
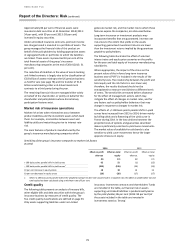
Credit risk in BSM is predominantly limited to short-term
bank exposure created by interbank lending, exposure to
central banks and high quality sovereigns, supranationals
or agencies which constitute the majority of BSM’s
liquidity portfolio. BSM does not manage the structural
credit risk of any Group entity balance sheets.
BSM is permitted to enter into single name and index
credit derivatives activity, but it does so to manage credit
risk on the exposure specific to its securities portfolio in
limited circumstances only. The risk limits are extremely
limited and closely monitored. At 31 December 2014 and
31 December 2013 BSM had no open credit derivative
index risk.
VaR is calculated on both trading and non-trading
positions held in BSM. It is calculated by applying the
same methodology used for the Markets business and
utilised as a tool for market risk control purposes.BSM
holds trading portfolio instruments in only very limited
circumstances. Positions and the associated VaR were
not significant during 2014 and 2013.
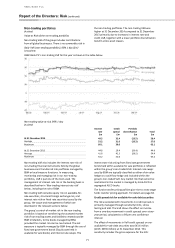
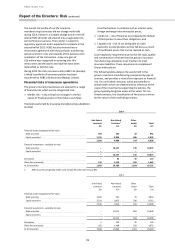
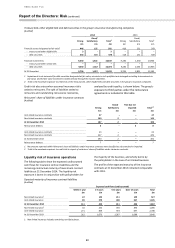
Sensitivity of net interest income
(Unaudited)
A principal element of the group’s management of
market risk in non-trading portfolios is monitoring the
sensitivity of projected net interest income under varying
interest rate scenarios (simulation modelling). The group
applies a combination of scenarios and assumptions
relevant to their local businesses, and standard scenarios
which are required throughout HSBC. The latter are
consolidated to illustrate the combined pro forma effect
on the consolidated net interest income.
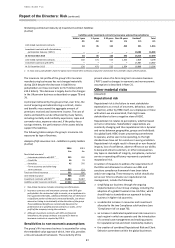
Projected net interest income sensitivity figures
represent the effect of the pro forma movements in net
interest income based on the projected yield curve
scenarios and the current interest rate risk profile. This
effect, however, does not incorporate actions which
would probably be taken by BSM or in the business units
to mitigate the effect of interest rate risk. In reality, BSM
seeks actively to change the interest rate risk profile to
minimise losses and optimise net revenues. The net
interest income sensitivity calculations assume that
interest rates of all maturities move by the same amount
in the ‘up-shock’ scenario. Rates are not assumed to
become negative in the ‘down-shock’ scenario which
may, in certain currencies, effectively result in non-
parallel shock. In addition, the net interest income
sensitivity calculations take account of the effect on net
interest income of anticipated differences in changes
between interbank interest rates and interest rates over
which the entity has discretion in terms of the timing and
extent of rate changes.
Defined benefit pension scheme
(Audited)
Market risk also arises within the group’s defined benefit
pension schemes to the extent that the obligations of
the schemes are not fully matched by assets with
determinable cash flows. Pension scheme obligations
fluctuate with changes in long-term interest rates,
inflation, salary increases and the longevity of scheme
members. Pension scheme assets will include equities
and debt securities, the cash flows of which change as
equity prices and interest rates vary. There are risks that
market movements in equity prices and interest rates
could result in assets which are insufficient over time to
cover the level of projected obligations and these, in
turn, could increase with a rise in inflation and members
living longer. Management, together with the trustees
who act on behalf of the pension scheme beneficiaries,
assess these risks using reports prepared by independent
external actuaries and takes action and, where
appropriate, adjust investment strategies and
contribution levels accordingly.