HSBC 2014 Annual Report Download - page 147
Download and view the complete annual report
Please find page 147 of the 2014 HSBC annual report below. You can navigate through the pages in the report by either clicking on the pages listed below, or by using the keyword search tool below to find specific information within the annual report.-
 1
1 -
2
-
3
-
4
-
5
-
6
-
7
-
8
-
9
-
10
-
11
-
12
-
13
-
14
-
15
-
16
-
17
-
18
-
19
-
20
-
21
-
22
-
23
-
24
-
25
-
26
-
27
-
28
-
29
-
30
-
31
-
32
-
33
-
34
-
35
-
36
-
37
-
38
-
39
-
40
-
41
-
42
-
43
-
44
-
45
-
46
-
47
-
48
-
49
-
50
-
51
-
52
-
53
-
54
-
55
-
56
-
57
-
58
-
59
-
60
-
61
-
62
-
63
-
64
-
65
-
66
-
67
-
68
-
69
-
70
-
71
-
72
-
73
-
74
-
75
-
76
-
77
-
78
-
79
-
80
-
81
-
82
-
83
-
84
-
85
-
86
-
87
-
88
-
89
-
90
-
91
-
92
-
93
-
94
-
95
-
96
-
97
-
98
-
99
-
100
-
101
-
102
-
103
-
104
-
105
-
106
-
107
-
108
-
109
-
110
-
111
-
112
-
113
-
114
-
115
-
116
-
117
-
118
-
119
-
120
-
121
-
122
-
123
-
124
-
125
-
126
-
127
-
128
-
129
-
130
-
131
-
132
-
133
-
134
-
135
-
136
-
 137
137 -
 138
138 -
 139
139 -
 140
140 -
 141
141 -
 142
142 -
 143
143 -
 144
144 -
 145
145 -
 146
146 -
 147
147 -
 148
148 -
 149
149 -
 150
150 -
 151
151 -
 152
152 -
 153
153 -
 154
154 -
 155
155 -
 156
156 -
 157
157 -
158
-
159
-
160
-
161
-
162
-
163
-
164
-
165
-
166
-
167
-
168
-
169
-
170
-
171
-
172
-
173
-
174
-
175
-
176
-
177
-
178
-
179
-
180
-
181
-
182
-
183
-
184
-
185
-
186
-
187
-
188
-
189
-
190
-
191
-
192
-
193
-
194
-
195
-
196
-
197
-
198
-
199
-
200
 |
 |

HSBC BANK PLC
Notes on the Financial Statements (continued)
145
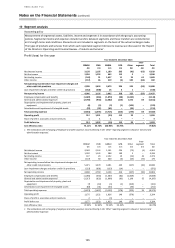
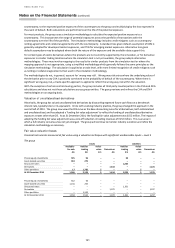
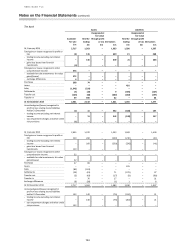
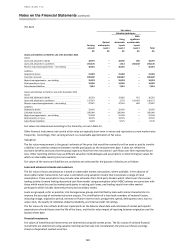
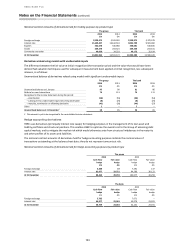
Effects of changes in significant unobservable assumptions to reasonably possible alternatives
The following table shows the sensitivity of Level 3 fair values to reasonably possible alternative assumptions:
The group
Reflected in profit or loss
Reflected in other
comprehensive income
Favourable
changes
Unfavourable
changes
Favourable
changes
Unfavourable
changes
£m
£m
£m
£m
At 31 December 2014
Derivatives/trading assets/trading liabilities1
161
(140)
–
–
Financial assets and liabilities designated at fair value
–
(1)
–
–
Financial investments: available-for-sale
11
(7)
73
(95)
At 31 December 2013
Derivatives/trading assets/trading liabilities1
180
(133)
–
–
Financial assets and liabilities designated at fair value
–
–
–
–
Financial investments: available-for-sale
–
–
89
(133)
The bank
Reflected in profit or loss
Reflected in other
comprehensive income
Favourable
changes
Unfavourable
changes
Favourable
changes
Unfavourable
changes
£m
£m
£m
£m
At 31 December 2014
Derivatives/trading assets/trading liabilities1
162
(150)
–
–
Financial assets and liabilities designated at fair value
–
–
–
–
Financial investments: available-for-sale
–
–
76
(90)
At 31 December 2013
Derivatives/trading assets/trading liabilities1
209
(146)
–
–
Financial assets and liabilities designated at fair value
–
–
–
–
Financial investments: available-for-sale
–
–
238
(276)
1 Derivatives, trading assets and trading liabilities are presented as one category to reflect the manner in which these financial
instruments are risk-managed.
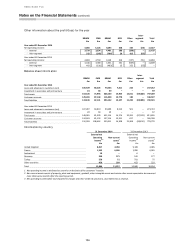
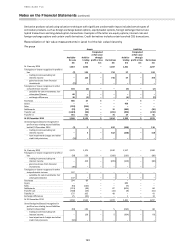
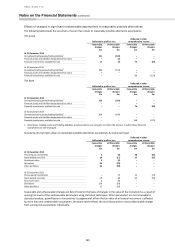
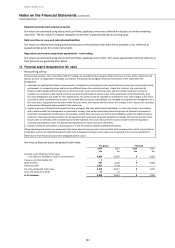
Sensitivity of Level 3 fair values to reasonably possible alternative assumptions by instrument type
Reflected in profit or loss
Reflected in other
comprehensive income
Favourable
changes
Unfavourable
changes
Favourable
changes
Unfavourable
changes
£m
£m
£m
£m
At 31 December 2014
Private equity investments
6
(6)
38
(60)
Asset-backed securities
28
(11)
35
(35)
Structured notes
6
(6)
–
–
Derivatives
69
(75)
–
–
Other portfolios
63
(50)
–
–
At 31 December 2013
Private equity investments
–
(7)
24
(74)
Asset-backed securities
28
(8)
65
(59)
Structured notes
6
(6)
–
–
Derivatives
129
(93)
–
–
Other portfolios
17
(19)
–
–
Favourable and unfavourable changes are determined on the basis of changes in the value of the instrument as a result of
varying the levels of the unobservable parameters using statistical techniques. When parameters are not amenable to
statistical analysis, quantification of uncertainty is judgemental. When the fair value of a financial instrument is affected
by more than one unobservable assumption, the above table reflects the most favourable or most unfavourable change
from varying the assumptions individually.