HSBC 2014 Annual Report Download - page 60
Download and view the complete annual report
Please find page 60 of the 2014 HSBC annual report below. You can navigate through the pages in the report by either clicking on the pages listed below, or by using the keyword search tool below to find specific information within the annual report.-
 1
1 -
2
-
3
-
4
-
5
-
6
-
7
-
8
-
9
-
10
-
11
-
12
-
13
-
14
-
15
-
16
-
17
-
18
-
19
-
20
-
21
-
22
-
23
-
24
-
25
-
26
-
27
-
28
-
29
-
30
-
31
-
32
-
33
-
34
-
35
-
36
-
37
-
38
-
39
-
40
-
41
-
42
-
43
-
44
-
45
-
46
-
47
-
48
-
49
-
 50
50 -
 51
51 -
 52
52 -
 53
53 -
 54
54 -
 55
55 -
 56
56 -
 57
57 -
 58
58 -
 59
59 -
 60
60 -
 61
61 -
 62
62 -
 63
63 -
 64
64 -
 65
65 -
 66
66 -
 67
67 -
 68
68 -
 69
69 -
 70
70 -
71
-
72
-
73
-
74
-
75
-
76
-
77
-
78
-
79
-
80
-
81
-
82
-
83
-
84
-
85
-
86
-
87
-
88
-
89
-
90
-
91
-
92
-
93
-
94
-
95
-
96
-
97
-
98
-
99
-
100
-
101
-
102
-
103
-
104
-
105
-
106
-
107
-
108
-
109
-
110
-
111
-
112
-
113
-
114
-
115
-
116
-
117
-
118
-
119
-
120
-
121
-
122
-
123
-
124
-
125
-
126
-
127
-
128
-
129
-
130
-
131
-
132
-
133
-
134
-
135
-
136
-
137
-
138
-
139
-
140
-
141
-
142
-
143
-
144
-
145
-
146
-
147
-
148
-
149
-
150
-
151
-
152
-
153
-
154
-
155
-
156
-
157
-
158
-
159
-
160
-
161
-
162
-
163
-
164
-
165
-
166
-
167
-
168
-
169
-
170
-
171
-
172
-
173
-
174
-
175
-
176
-
177
-
178
-
179
-
180
-
181
-
182
-
183
-
184
-
185
-
186
-
187
-
188
-
189
-
190
-
191
-
192
-
193
-
194
-
195
-
196
-
197
-
198
-
199
-
200
 |
 |
HSBC BANK PLC
Report of the Directors: Risk (continued)
58
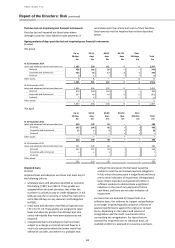
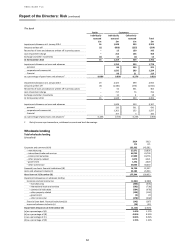
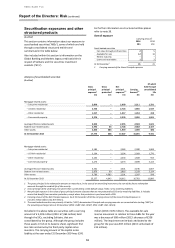
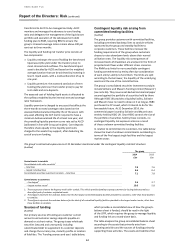
Securitisation exposures and other
structured products
(Audited)
This section contains information about our exposure to
asset-backed securities (‘ABSs’), some of which are held
through consolidated structured entities and
summarised in the table below.
Also included within this section is information on the
Global Banking and Markets legacy credit activities in
respect of Solitaire and the securities investment
conduits (‘SICs’).
For further information on structured entities please
refer to note 36.
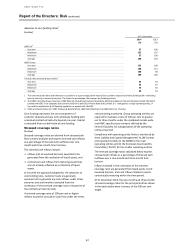
Overall exposure
Carrying amount1
2014
2013
£bn
£bn
Asset-backed securities
Fair value through profit and loss
2
5
Available for sale
12
14
Held to maturity
–
–
Loans and receivables
1
2
At 31 December1
15
21
1 Carrying amount of the Gross Principal exposure
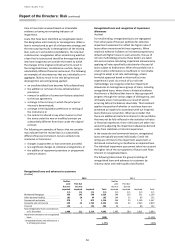
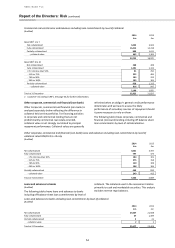
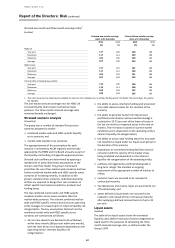
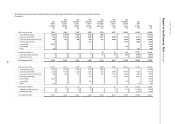
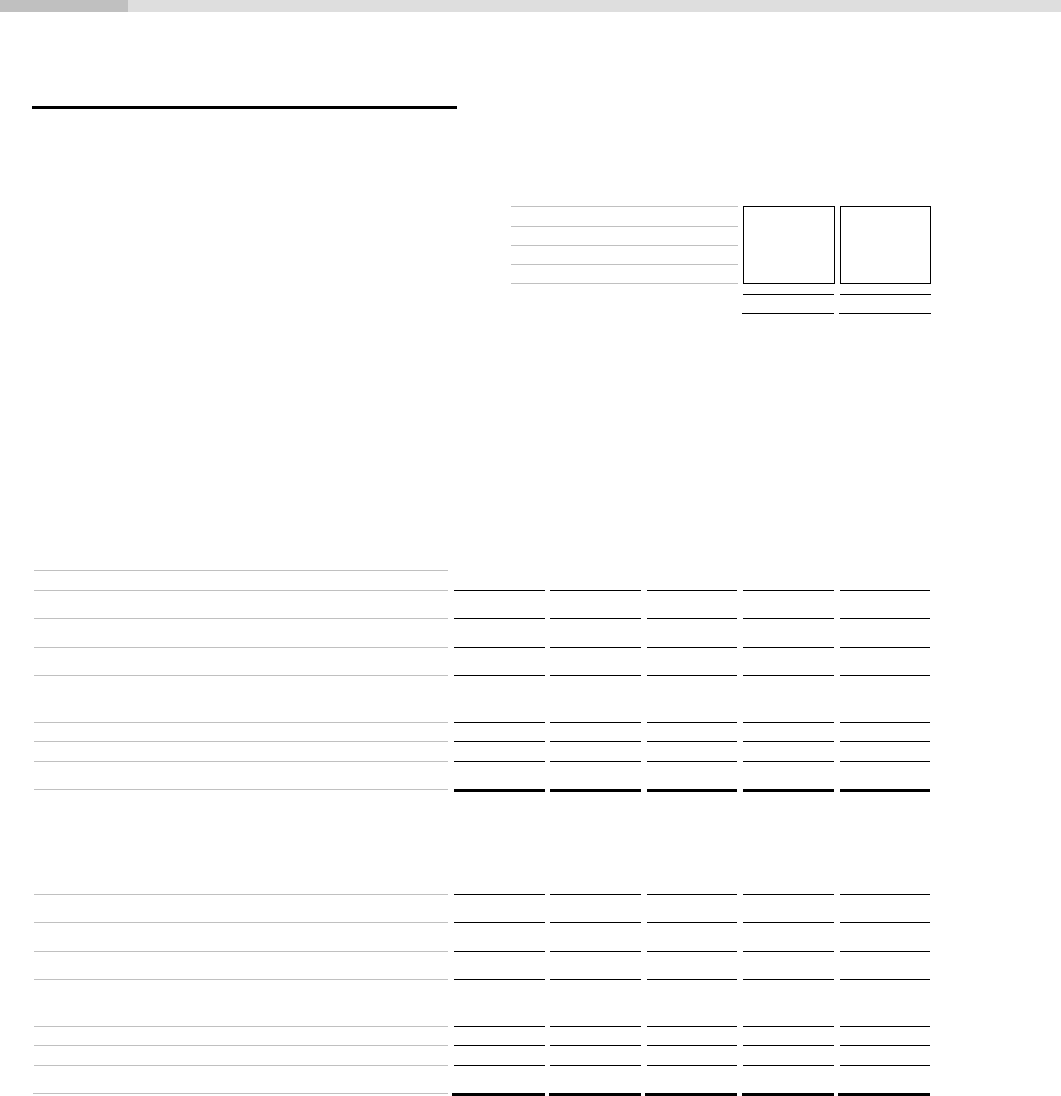
Analysis of asset-backed securities
(Audited)
Gross
principal
exposure
1
Gross
principal
protection
2
Net
principal
exposure
3,5
Carrying
Amount
4,5
Of which
held through
consolidated
SEs
£m
£m
£m
£m
£m
Mortgage-related assets:
– Sub-prime residential
2,609
–
2,609
2,211
1,331
– US Alt-A residential
2,723
–
2,723
1,965
1,547
– Other residential
1,517
–
1,517
1,454
418
– Commercial property
3,276
–
3,276
3,050
1,831
Leveraged finance-related assets:
2,555
–
2,555
2,503
1,621
Student loan-related assets:
2,792
64
2,728
2,382
2,107
Other assets:
2,303
384
1,919
1,490
486
At 31 December 2014
17,775
448
17,327
15,055
9,341
Mortgage-related assets:
– Sub-prime residential
2,583
–
2,583
2,080
1,683
– US Alt-A residential
3,204
–
3,204
2,083
1,770
– Other residential
2,234
–
2,234
1,608
915
– Commercial property
4,273
–
4,273
3,899
3,113
Leveraged finance-related assets:
3,301
–
3,301
3,196
2,607
Student loan-related assets:
2,876
60
2,816
2,329
2,114
Other assets:
6,786
4,585
2,201
1,587
598
At 31 December 2013
25,257
4,645
20,612
16,782
12,800
1 The gross principal is the redemption amount on maturity or, in the case of an amortising instrument, the sum of the future redemption
amounts through the residual life of the security.
2 Gross principal of the underlying instrument that is protected by credit default swaps (‘CDSs’) or by matching liabilities.
3 Net principal exposure is the value of gross principal amount of assets that are not protected by CDSs or by matching liabilities. It includes
assets that benefit from monoline protection, except where this protection is purchased with a CDS.
4 Carrying amount of the Net Principal exposure. As at 31 December 2014 the carrying amount of the Gross Principal Exposure is
£ 15,471 million (2013: £21,367 million).
5 The asset backed securities are primarily US dollar (‘USD’) denominated. Principal and carrying amounts are converted into sterling (‘GBP’) at
the prevailing exchange rates at 31 December (2014: 1GBP: USD 1.5587; 2013: 1GBP: USD 1.6531).
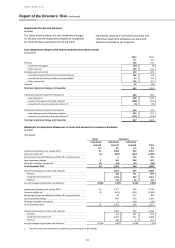
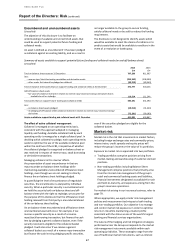
Included in the above table are securities with a carrying
amount of £ 4,205 million (2013: £7,364 million) held
through the SICs, excluding Solitaire, that are
consolidated by the group. Although the group includes
these assets in full on its balance sheet, significant first
loss risks are borne by the third party capital notes
investors. The carrying amount of the capital notes
liability at the year ended 31 December 2014 was £241
million (2013: £276 million). The available-for-sale
reserve movement in relation to these ABSs for the year
was a decrease of £68 million (2013: decrease of £358
million). The impairment write-back attributed to the
group for the year was £67 million (2013: write-back of
£13 million).