HSBC 2014 Annual Report Download - page 146
Download and view the complete annual report
Please find page 146 of the 2014 HSBC annual report below. You can navigate through the pages in the report by either clicking on the pages listed below, or by using the keyword search tool below to find specific information within the annual report.-
 1
1 -
2
-
3
-
4
-
5
-
6
-
7
-
8
-
9
-
10
-
11
-
12
-
13
-
14
-
15
-
16
-
17
-
18
-
19
-
20
-
21
-
22
-
23
-
24
-
25
-
26
-
27
-
28
-
29
-
30
-
31
-
32
-
33
-
34
-
35
-
36
-
37
-
38
-
39
-
40
-
41
-
42
-
43
-
44
-
45
-
46
-
47
-
48
-
49
-
50
-
51
-
52
-
53
-
54
-
55
-
56
-
57
-
58
-
59
-
60
-
61
-
62
-
63
-
64
-
65
-
66
-
67
-
68
-
69
-
70
-
71
-
72
-
73
-
74
-
75
-
76
-
77
-
78
-
79
-
80
-
81
-
82
-
83
-
84
-
85
-
86
-
87
-
88
-
89
-
90
-
91
-
92
-
93
-
94
-
95
-
96
-
97
-
98
-
99
-
100
-
101
-
102
-
103
-
104
-
105
-
106
-
107
-
108
-
109
-
110
-
111
-
112
-
113
-
114
-
115
-
116
-
117
-
118
-
119
-
120
-
121
-
122
-
123
-
124
-
125
-
126
-
127
-
128
-
129
-
130
-
131
-
132
-
133
-
134
-
135
-
 136
136 -
 137
137 -
 138
138 -
 139
139 -
 140
140 -
 141
141 -
 142
142 -
 143
143 -
 144
144 -
 145
145 -
 146
146 -
 147
147 -
 148
148 -
 149
149 -
 150
150 -
 151
151 -
 152
152 -
 153
153 -
 154
154 -
 155
155 -
 156
156 -
157
-
158
-
159
-
160
-
161
-
162
-
163
-
164
-
165
-
166
-
167
-
168
-
169
-
170
-
171
-
172
-
173
-
174
-
175
-
176
-
177
-
178
-
179
-
180
-
181
-
182
-
183
-
184
-
185
-
186
-
187
-
188
-
189
-
190
-
191
-
192
-
193
-
194
-
195
-
196
-
197
-
198
-
199
-
200
 |
 |

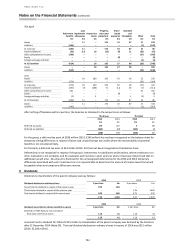
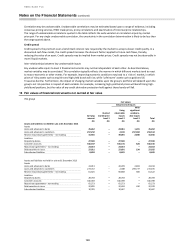
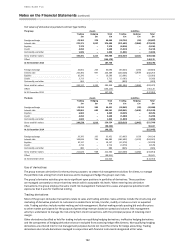
HSBC BANK PLC
Notes on the Financial Statements (continued)
144
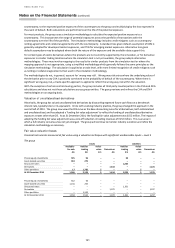
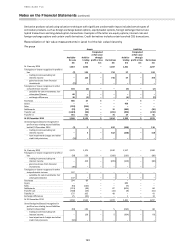
The bank
Assets
Liabilities
Available-
for-sale
Held for
trading
Designated at
fair value
through profit
or loss
Derivatives
Held for
trading
Designated at
fair value
through profit
or loss
Derivatives
£m
£m
£m
£m
£m
£m
£m
At 1 January 2014
2,717
1,563
–
1,083
1,290
–
1,367
Total gains or losses recognised in profit or
loss
(4)
136
–
649
21
–
268
- trading income excluding net interest
income
–
136
–
649
21
–
268
- gains less losses from financial
investments
(4)
–
–
–
–
–
–
Total gains or losses recognised in other
comprehensive income
576
–
–
–
–
–
–
- available-for-sale investments: fair value
gains/(losses)
572
–
–
–
–
–
–
- exchange differences
4
–
–
–
–
–
–
Purchases
208
74
–
–
–
–
–
Issues
–
–
–
–
432
–
–
Sales
(1,042)
(254)
–
–
–
–
–
Settlements
(7)
(19)
–
9
(305)
–
(127)
Transfer out
(126)
(58)
–
(202)
(202)
–
(197)
Transfer in
39
690
–
82
–
–
66
At 31 December 2014
2,361
2,132
–
1,621
1,236
–
1,377
Unrealised gains/(losses) recognised in
profit or loss relating to and liabilities
held at 31 December
(1)
11
–
542
(108)
–
147
- trading income excluding net interest
income
–
11
–
542
(108)
–
147
- loan impairment charges and other credit
risk provisions
(1)
–
–
–
–
–
–
At 1 January 2013
2,635
1,370
–
1,233
1,469
–
1,400
Total gains or losses recognised in profit or
loss
129
260
–
(230)
(230)
–
(41)
- trading income excluding net interest
income
–
260
–
(230)
(230)
–
(41)
- gains less losses from financial
investments
129
–
–
–
–
–
–
Total gains or losses recognised in other
comprehensive income
32
–
–
–
–
–
–
- available-for-sale investments: fair value
gains/(losses)
32
–
–
–
–
–
–
Purchases
37
89
–
–
–
–
–
Issues
–
–
–
–
631
–
–
Sales
(82)
(110)
–
–
–
–
–
Settlements
(25)
(41)
–
71
(573)
–
47
Transfer out
(3)
(43)
–
(17)
(8)
–
(68)
Transfer in
–
76
–
27
–
–
21
Exchange differences
(6)
(38)
–
(1)
1
–
8
At 31 December 2013
2,717
1,563
–
1,083
1,290
–
1,367
Unrealised gains/(losses) recognised in
profit or loss relating to and liabilities
held at 31 December
132
140
–
(76)
(264)
–
21
- trading income excluding net interest
income
–
140
–
(76)
(264)
–
21
- loan impairment charges and other credit
risk provisions
132
–
–
–
–
–
–