HSBC 2014 Annual Report Download - page 26
Download and view the complete annual report
Please find page 26 of the 2014 HSBC annual report below. You can navigate through the pages in the report by either clicking on the pages listed below, or by using the keyword search tool below to find specific information within the annual report.-
 1
1 -
2
-
3
-
4
-
5
-
6
-
7
-
8
-
9
-
10
-
11
-
12
-
13
-
14
-
15
-
 16
16 -
 17
17 -
 18
18 -
 19
19 -
 20
20 -
 21
21 -
 22
22 -
 23
23 -
 24
24 -
 25
25 -
 26
26 -
 27
27 -
 28
28 -
 29
29 -
 30
30 -
 31
31 -
 32
32 -
 33
33 -
 34
34 -
 35
35 -
 36
36 -
37
-
38
-
39
-
40
-
41
-
42
-
43
-
44
-
45
-
46
-
47
-
48
-
49
-
50
-
51
-
52
-
53
-
54
-
55
-
56
-
57
-
58
-
59
-
60
-
61
-
62
-
63
-
64
-
65
-
66
-
67
-
68
-
69
-
70
-
71
-
72
-
73
-
74
-
75
-
76
-
77
-
78
-
79
-
80
-
81
-
82
-
83
-
84
-
85
-
86
-
87
-
88
-
89
-
90
-
91
-
92
-
93
-
94
-
95
-
96
-
97
-
98
-
99
-
100
-
101
-
102
-
103
-
104
-
105
-
106
-
107
-
108
-
109
-
110
-
111
-
112
-
113
-
114
-
115
-
116
-
117
-
118
-
119
-
120
-
121
-
122
-
123
-
124
-
125
-
126
-
127
-
128
-
129
-
130
-
131
-
132
-
133
-
134
-
135
-
136
-
137
-
138
-
139
-
140
-
141
-
142
-
143
-
144
-
145
-
146
-
147
-
148
-
149
-
150
-
151
-
152
-
153
-
154
-
155
-
156
-
157
-
158
-
159
-
160
-
161
-
162
-
163
-
164
-
165
-
166
-
167
-
168
-
169
-
170
-
171
-
172
-
173
-
174
-
175
-
176
-
177
-
178
-
179
-
180
-
181
-
182
-
183
-
184
-
185
-
186
-
187
-
188
-
189
-
190
-
191
-
192
-
193
-
194
-
195
-
196
-
197
-
198
-
199
-
200
 |
 |

HSBC BANK PLC
Strategic Report: Business Review (continued)
24
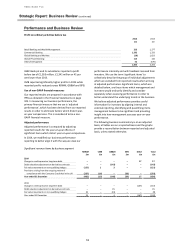
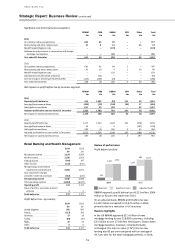
Other
2014
2013
£m
£m
Net interest income
(42)
(73)
Net fee income
2
3
Trading income
24
(22)
Change in credit spread on long
-
term debt
17
(167)
Other income
323
102
Net operating
income before
impairments and provisions
324
(157)
Loan impairment charges and other
credit risk provisions
1
–
Net operating income/(expense)
325
(157)
Total operating expenses
(273)
(222)
Operating (loss)/profit
52
(379)
Share of profit in associates and joint
ventures
–
–
Profit/(loss) before tax
52
(379)
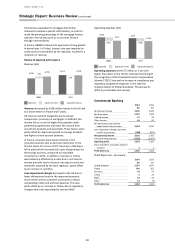
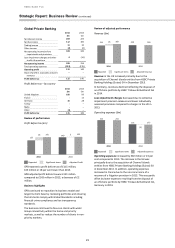
Profit before tax (£m)
Other profit before tax was £52 million compared to a
loss of £379 million in 2013, an increase of £431 million.
Other adjusted profit before tax was £70 million
compared to a loss of £182 million in 2013, an increase
of £252 million.
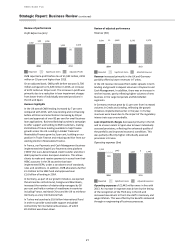
Review of adjusted performance
Revenue (£m)
Revenue increased primarily due to gain arising from
external hedging of an intra-group financing transaction
of £114 million and favourable fair value movements of
£25 million from interest and exchange rate
ineffectiveness in the hedging of long-term debt issued
principally by the group in 2014 compared to adverse
movements of £46 million in 2013.
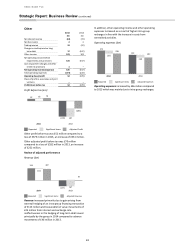
In addition, other operating income and other operating
expenses increased as a result of higher intra-group
recharges in line with the increase in costs from
centralised activities.
Operating expenses (£m)
Operating expenses increased by £46 million compared
to 2013 which was mainly due to intra-group recharges.
52
(379)
18 70
197
(182)
2014
2013
Adjusted Profit
Reported
Significant items
324
(157)
(17)
307
167
10
2014
2013
Adjusted RevenueReported
Significant items
273
222
(35)
238
(30)
192
2014
2013
Adjusted ExpensesReported
Significant items