HSBC 2014 Annual Report Download - page 22
Download and view the complete annual report
Please find page 22 of the 2014 HSBC annual report below. You can navigate through the pages in the report by either clicking on the pages listed below, or by using the keyword search tool below to find specific information within the annual report.-
 1
1 -
2
-
3
-
4
-
5
-
6
-
7
-
8
-
9
-
10
-
11
-
 12
12 -
 13
13 -
 14
14 -
 15
15 -
 16
16 -
 17
17 -
 18
18 -
 19
19 -
 20
20 -
 21
21 -
 22
22 -
 23
23 -
 24
24 -
 25
25 -
 26
26 -
 27
27 -
 28
28 -
 29
29 -
 30
30 -
 31
31 -
 32
32 -
33
-
34
-
35
-
36
-
37
-
38
-
39
-
40
-
41
-
42
-
43
-
44
-
45
-
46
-
47
-
48
-
49
-
50
-
51
-
52
-
53
-
54
-
55
-
56
-
57
-
58
-
59
-
60
-
61
-
62
-
63
-
64
-
65
-
66
-
67
-
68
-
69
-
70
-
71
-
72
-
73
-
74
-
75
-
76
-
77
-
78
-
79
-
80
-
81
-
82
-
83
-
84
-
85
-
86
-
87
-
88
-
89
-
90
-
91
-
92
-
93
-
94
-
95
-
96
-
97
-
98
-
99
-
100
-
101
-
102
-
103
-
104
-
105
-
106
-
107
-
108
-
109
-
110
-
111
-
112
-
113
-
114
-
115
-
116
-
117
-
118
-
119
-
120
-
121
-
122
-
123
-
124
-
125
-
126
-
127
-
128
-
129
-
130
-
131
-
132
-
133
-
134
-
135
-
136
-
137
-
138
-
139
-
140
-
141
-
142
-
143
-
144
-
145
-
146
-
147
-
148
-
149
-
150
-
151
-
152
-
153
-
154
-
155
-
156
-
157
-
158
-
159
-
160
-
161
-
162
-
163
-
164
-
165
-
166
-
167
-
168
-
169
-
170
-
171
-
172
-
173
-
174
-
175
-
176
-
177
-
178
-
179
-
180
-
181
-
182
-
183
-
184
-
185
-
186
-
187
-
188
-
189
-
190
-
191
-
192
-
193
-
194
-
195
-
196
-
197
-
198
-
199
-
200
 |
 |

HSBC BANK PLC
Strategic Report: Business Review (continued)
20
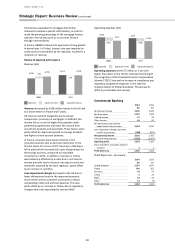
the business expanded its mortgage distribution
channels to include a specific intermediary, in order to
reach the growing percentage of the mortgage finance
market in the UK who wish to source their finance
through intermediaries
In France, RBWM continued to experience strong growth
in home loans. In Turkey, interest rate caps imposed on
credit cards and overdrafts by the regulator resulted in a
reduction in revenue.
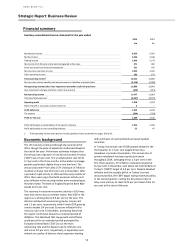
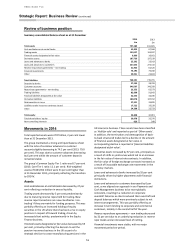
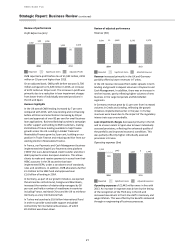
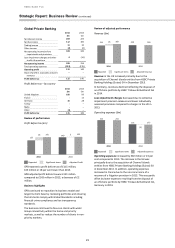
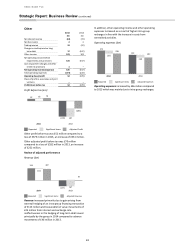
Review of adjusted performance
Revenue (£m)
Revenue decreased by £338 million mainly in the UK and
to a lesser extent in France and Turkey.
UK revenue reduced marginally due to spread
compression, primarily on mortgages. In addition, fee
income fell as a result of higher fees payable under
partnership agreements and lower fee income from
investment products and overdrafts. These factors were
partly offset by improved spreads on savings products
and higher current account balances.
In France, revenues were lower primarily in the
insurance business due to adverse movements in the
Present Value of In-Force (‘PVIF’) business, reflecting a
fall in yields which increased the costs of guarantees on
the savings business, compared to favourable
movements in 2013. In addition, revenues in Turkey
were adversely affected by a reduction in net interest
income primarily due to interest rate caps on cards and
overdrafts imposed by the local regulator, partly offset
by an increase in card fees.
Loan impairment charges decreased in the UK due to
lower delinquency levels in the improved economic
environment and as customers continued to reduce
outstanding credit card and loan balances. This was
partly offset by an increase in Turkey due to regulatory
changes adversely impacting the card portfolio.
Operating expenses (£m)
Operating expenses were £72 million or 2 per cent
higher than 2013. In the UK this reflected the timing of
the recognition of the Financial Services Compensation
Scheme (‘FSCS’) levy and an increase in compliance and
regulatory programme expenses in line with the
implementation of Global Standards. This was partly
offset by sustainable cost savings.
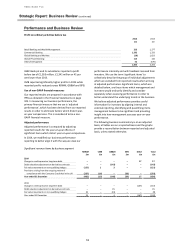
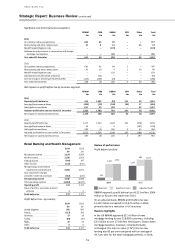
Commercial Banking
2014
2013
£m
£m
Net interest income
2,195
2,144
Net fee income
1,153
1,143
Trading income
21
23
Other income
65
60
Net operating income before
impairments and provisions
3,434
3,370
Loan impairment charges and other
credit risk provisions
(308)
(601)
Net operating income
3,126
2,769
Total operating expenses
(1,535)
(1,437)
Operating profit
1,591
1,332
Share of profit in associates and joint
ventures
1
1
Profit before tax
1,592
1,333
Profit before tax – by country
2014
2013
£m
£m
United Kingdom
1,377
1,075
France
146
163
Germany
43
45
Turkey
2
24
Malta
10
33
Other
14
(7)
Profit before tax
1,592
1,333
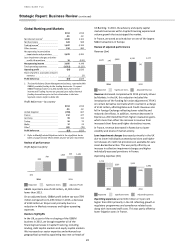
4,208
5,071
492 4,700
(33)
5,038
2014
2013
Adjusted RevenueReported
Significant items
3,834 3,673
(617)
3,217
(528)
3,145
2014
2013
Adjusted ExpensesReported
Significant items