HSBC 2014 Annual Report Download - page 41
Download and view the complete annual report
Please find page 41 of the 2014 HSBC annual report below. You can navigate through the pages in the report by either clicking on the pages listed below, or by using the keyword search tool below to find specific information within the annual report.-
 1
1 -
2
-
3
-
4
-
5
-
6
-
7
-
8
-
9
-
10
-
11
-
12
-
13
-
14
-
15
-
16
-
17
-
18
-
19
-
20
-
21
-
22
-
23
-
24
-
25
-
26
-
27
-
28
-
29
-
30
-
 31
31 -
 32
32 -
 33
33 -
 34
34 -
 35
35 -
 36
36 -
 37
37 -
 38
38 -
 39
39 -
 40
40 -
 41
41 -
 42
42 -
 43
43 -
 44
44 -
 45
45 -
 46
46 -
 47
47 -
 48
48 -
 49
49 -
 50
50 -
 51
51 -
52
-
53
-
54
-
55
-
56
-
57
-
58
-
59
-
60
-
61
-
62
-
63
-
64
-
65
-
66
-
67
-
68
-
69
-
70
-
71
-
72
-
73
-
74
-
75
-
76
-
77
-
78
-
79
-
80
-
81
-
82
-
83
-
84
-
85
-
86
-
87
-
88
-
89
-
90
-
91
-
92
-
93
-
94
-
95
-
96
-
97
-
98
-
99
-
100
-
101
-
102
-
103
-
104
-
105
-
106
-
107
-
108
-
109
-
110
-
111
-
112
-
113
-
114
-
115
-
116
-
117
-
118
-
119
-
120
-
121
-
122
-
123
-
124
-
125
-
126
-
127
-
128
-
129
-
130
-
131
-
132
-
133
-
134
-
135
-
136
-
137
-
138
-
139
-
140
-
141
-
142
-
143
-
144
-
145
-
146
-
147
-
148
-
149
-
150
-
151
-
152
-
153
-
154
-
155
-
156
-
157
-
158
-
159
-
160
-
161
-
162
-
163
-
164
-
165
-
166
-
167
-
168
-
169
-
170
-
171
-
172
-
173
-
174
-
175
-
176
-
177
-
178
-
179
-
180
-
181
-
182
-
183
-
184
-
185
-
186
-
187
-
188
-
189
-
190
-
191
-
192
-
193
-
194
-
195
-
196
-
197
-
198
-
199
-
200
 |
 |

HSBC BANK PLC
Report of the Directors: Risk (continued)
39
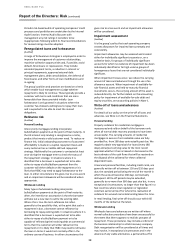
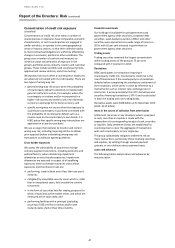
exchange for a commitment to repay the remaining
balance.
In the event of bankruptcy or analogous proceedings,
write-off for both personal and wholesale lending may
occur earlier than at the periods stated above.
Collections procedures may continue after write-off.
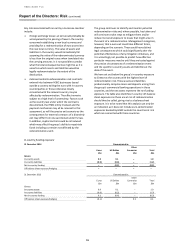
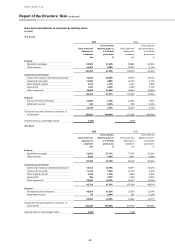
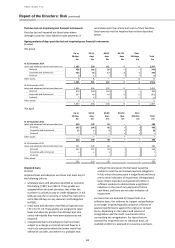
Maximum exposure to credit risk
(Audited)
The following table presents the maximum exposure to
credit risk from balance sheet and off-balance sheet
financial instruments, before taking account any
collateral held or other credit enhancements (where
such credit enhancements do not meet offsetting
requirements). For financial assets recognised on the
balance sheet, the maximum exposure to credit risk
equals their carrying amount; for financial guarantees
granted, it is the maximum amount that the group would
have to pay if the guarantees were called upon. For loan
commitments and other credit-related commitments
that are irrevocable over the life of the respective
facilities, it is generally the full amount of the committed
facilities.
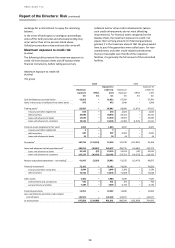
Maximum exposure to credit risk
(Audited)
The group
2014
2013
Maximum
exposure
Offset
Exposure to
credit risk
(net)
Maximum
exposure
Offset
Exposure to
credit risk
(net)
£m
£m
£m
£m
£m
£m
Cash and balances at central banks
42,853
–
42,853
67,584
–
67,584
Items in the course of collection from other banks
973
–
973
1,948
–
1,948
Trading assets1
85,885
–
85,885
98,090
(1,075)
97,015
treasury and other eligible bills
653
–
653
2,623
–
2,623
debt securities
49,996
–
49,996
56,414
–
56,414
loans and advances to banks
15,640
–
15,640
16,067
–
16,067
loans and advances to customers
19,596
–
19,596
22,986
(1,075)
21,911
Financial assets designated at fair value1
1,044
–
1,044
6,947
–
6,947
treasury and other eligible bills
3
–
3
–
–
–
debt securities
987
–
987
6,903
–
6,903
loans and advances to banks
54
–
54
44
–
44
Derivatives2
187,736
(174,118)
13,618
137,239
(112,931)
24,308
Loans and advances held at amortised cost3
282,514
(36,687)
245,827
296,735
(54,462)
242,273
loans and advances to banks
25,262
(37)
25,225
23,013
(92)
22,921
loans and advances to customers
257,252
(36,650)
220,602
273,722
(54,370)
219,352
Reverse repurchase agreements – non-trading3
41,945
(3,283)
38,662
61,525
(13,470)
48,055
Financial investments1
75,185
–
75,185
74,024
–
74,024
treasury and other similar bills
2,849
–
2,849
2,196
–
2,196
debt securities
72,336
–
72,336
71,828
–
71,828
Other assets
7,980
–
7,980
7,439
–
7,439
endorsements and acceptances
591
–
591
703
–
703
accrued income and other
7,389
–
7,389
6,736
–
6,736
Financial guarantees
13,452
–
13,452
11,846
–
11,846
Loan commitments and other credit
-related
commitments
135,522
–
135,522
123,017
–
123,017
At 31 December
875,089
(214,088)
661,001
886,394
(181,938)
704,456