HSBC 2014 Annual Report Download - page 175
Download and view the complete annual report
Please find page 175 of the 2014 HSBC annual report below. You can navigate through the pages in the report by either clicking on the pages listed below, or by using the keyword search tool below to find specific information within the annual report.-
 1
1 -
2
-
3
-
4
-
5
-
6
-
7
-
8
-
9
-
10
-
11
-
12
-
13
-
14
-
15
-
16
-
17
-
18
-
19
-
20
-
21
-
22
-
23
-
24
-
25
-
26
-
27
-
28
-
29
-
30
-
31
-
32
-
33
-
34
-
35
-
36
-
37
-
38
-
39
-
40
-
41
-
42
-
43
-
44
-
45
-
46
-
47
-
48
-
49
-
50
-
51
-
52
-
53
-
54
-
55
-
56
-
57
-
58
-
59
-
60
-
61
-
62
-
63
-
64
-
65
-
66
-
67
-
68
-
69
-
70
-
71
-
72
-
73
-
74
-
75
-
76
-
77
-
78
-
79
-
80
-
81
-
82
-
83
-
84
-
85
-
86
-
87
-
88
-
89
-
90
-
91
-
92
-
93
-
94
-
95
-
96
-
97
-
98
-
99
-
100
-
101
-
102
-
103
-
104
-
105
-
106
-
107
-
108
-
109
-
110
-
111
-
112
-
113
-
114
-
115
-
116
-
117
-
118
-
119
-
120
-
121
-
122
-
123
-
124
-
125
-
126
-
127
-
128
-
129
-
130
-
131
-
132
-
133
-
134
-
135
-
136
-
137
-
138
-
139
-
140
-
141
-
142
-
143
-
144
-
145
-
146
-
147
-
148
-
149
-
150
-
151
-
152
-
153
-
154
-
155
-
156
-
157
-
158
-
159
-
160
-
161
-
162
-
163
-
164
-
 165
165 -
 166
166 -
 167
167 -
 168
168 -
 169
169 -
 170
170 -
 171
171 -
 172
172 -
 173
173 -
 174
174 -
 175
175 -
 176
176 -
 177
177 -
 178
178 -
 179
179 -
 180
180 -
 181
181 -
 182
182 -
 183
183 -
 184
184 -
 185
185 -
186
-
187
-
188
-
189
-
190
-
191
-
192
-
193
-
194
-
195
-
196
-
197
-
198
-
199
-
200
 |
 |
HSBC BANK PLC
Notes on the Financial Statements (continued)
173
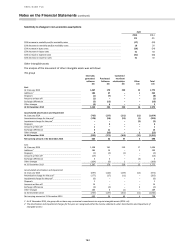
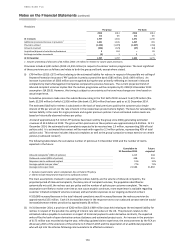
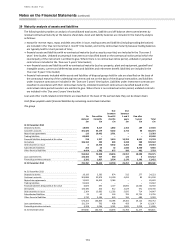
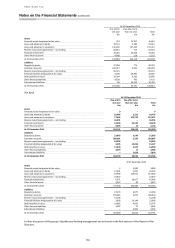
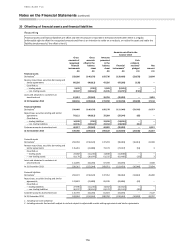
29 Maturity analysis of assets and liabilities
The following table provides an analysis of consolidated total assets, liabilities and off-balance sheet commitments by
residual contractual maturity at the balance sheet date. Asset and liability balances are included in the maturity analysis
as follows:
• except for reverse repos, repos and debt securities in issue, trading assets and liabilities (including trading derivatives)
are included in the ‘Due not more than 1 month’ time bucket, and not by contractual maturity because trading balances
are typically held for short periods of time;
• financial assets and liabilities with no contractual maturity (such as equity securities) are included in the ‘Due over 5
years’ time bucket. Undated or perpetual instruments are classified based on the contractual notice period which the
counterparty of the instrument is entitled to give. Where there is no contractual notice period, undated or perpetual
contracts are included in the ‘Due over 5 years’ time bucket;
• non-financial assets and liabilities with no contractual maturity (such as property, plant and equipment, goodwill and
intangible assets, current and deferred tax assets and liabilities and retirement benefit liabilities) are included in the
‘Due over 5 years’ time bucket;
• financial instruments included within assets and liabilities of disposal groups held for sale are classified on the basis of
the contractual maturity of the underlying instruments and not on the basis of the disposal transaction; and liabilities
under insurance contracts are included in the ‘Due over 5 years’ time bucket. Liabilities under investment contracts are
classified in accordance with their contractual maturity. Undated investment contracts are classified based on the
contractual notice period investors are entitled to give. Where there is no contractual notice period, undated contracts
are included in the ‘Due over 5 years’ time bucket.
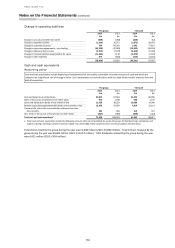
Loan and other credit-related commitments are classified on the basis of the earliest date they can be drawn down.
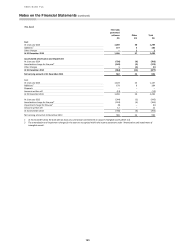
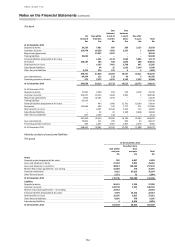
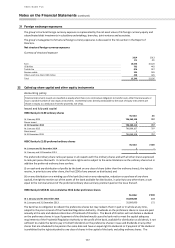
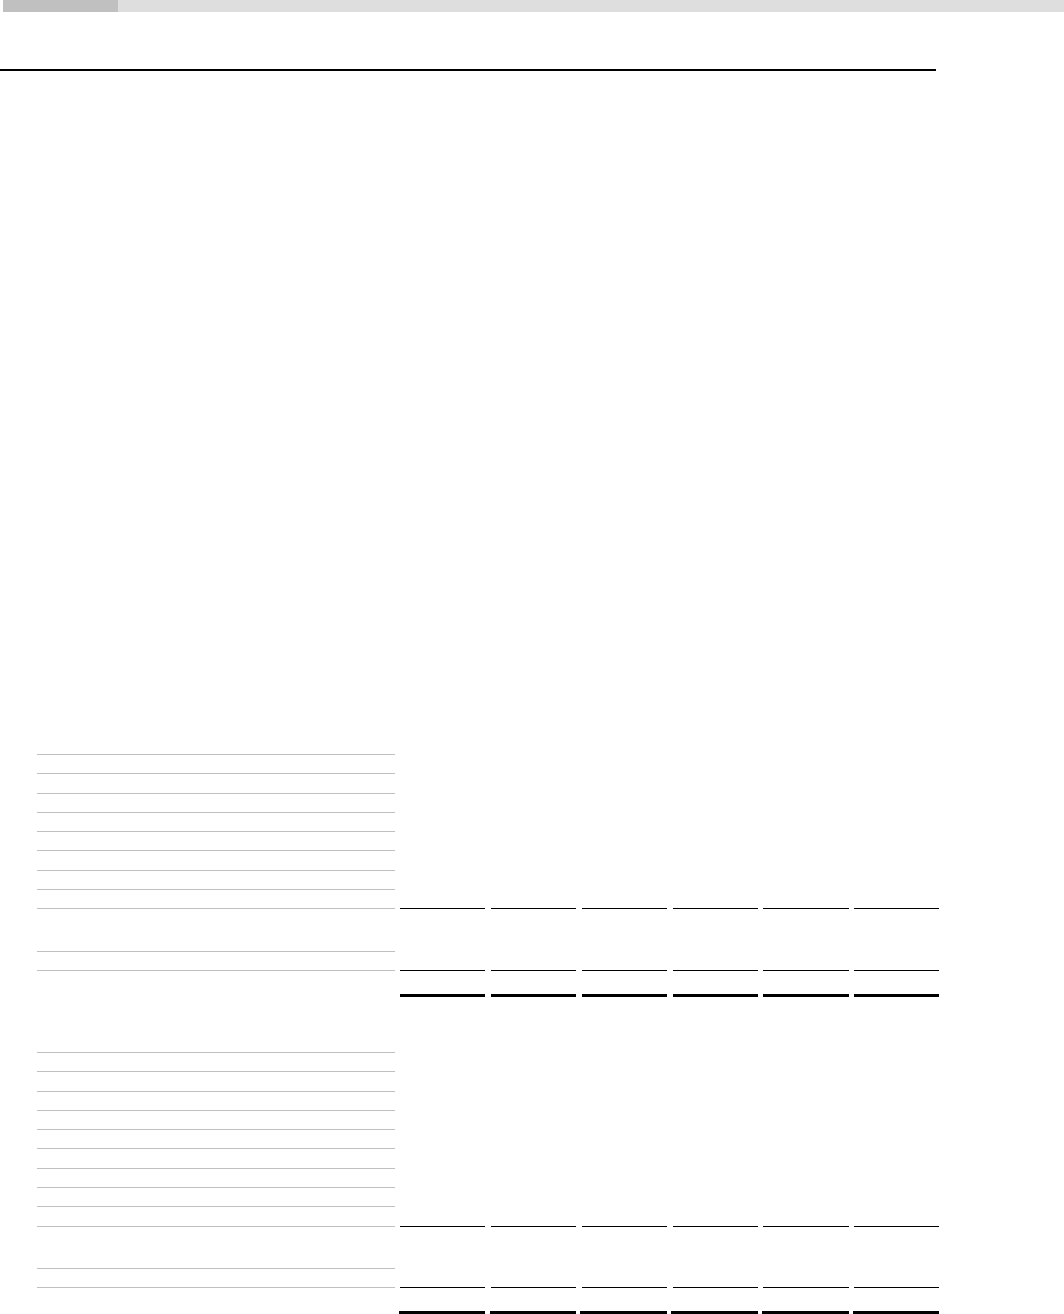
Cash flows payable under financial liabilities by remaining contractual maturities
The group
On
demand
Due within
3 months
Due
between
3 and 12
months
Due
between
1 and 5
years
Due after
5 years
Total
£m
£m
£m
£m
£m
£m
At 31 December 2014
Deposits by banks
18,890
6,217
1,062
1,352
109
27,630
Customer accounts
301,426
33,179
9,262
2,710
98
346,675
Repurchase agreements
110
19,492
3,781
–
–
23,383
Trading liabilities
82,600
–
–
–
–
82,600
Financial liabilities designated at fair value
218
1,257
3,419
10,204
8,651
23,749
Derivatives
186,160
183
683
2,248
268
189,542
Debt securities in issue
3
13,753
9,542
5,203
852
29,353
Subordinated liabilities
203
45
32
1,040
8,530
9,850
Other financial liabilities
4,454
1,782
875
200
482
7,793
594,064
75,908
28,656
22,957
18,990
740,575
Loan commitments
134,306
707
380
124
5
135,522
Financial guarantee contracts
3,392
1,827
3,754
2,176
2,303
13,452
At 31 December 2014
731,762
78,442
32,790
25,257
21,298
889,549
At 31 December 2013
Deposits by banks
19,193
3,365
874
512
277
24,221
Customer accounts
303,886
32,870
10,290
4,059
85
351,190
Repurchase agreements
11,841
44,695
9,084
–
–
65,620
Trading liabilities
91,842
–
–
–
–
91,842
Financial liabilities designated at fair value
6,825
493
1,477
15,692
14,063
38,550
Derivatives
135,490
204
912
2,529
571
139,706
Debt securities in issue
2,364
13,682
12,392
5,695
714
34,847
Subordinated liabilities
33
62
144
783
12,734
13,756
Other financial liabilities
1,730
5,494
922
194
680
9,020
573,204
100,865
36,095
29,464
29,124
768,752
Loan commitments
121,324
792
408
459
34
123,017
Financial guarantee contracts
3,328
1,066
3,591
1,842
2,019
11,846
At 31 December 2013
697,856
102,723
40,094
31,765
31,177
903,615