HSBC 2014 Annual Report Download - page 138
Download and view the complete annual report
Please find page 138 of the 2014 HSBC annual report below. You can navigate through the pages in the report by either clicking on the pages listed below, or by using the keyword search tool below to find specific information within the annual report.-
 1
1 -
2
-
3
-
4
-
5
-
6
-
7
-
8
-
9
-
10
-
11
-
12
-
13
-
14
-
15
-
16
-
17
-
18
-
19
-
20
-
21
-
22
-
23
-
24
-
25
-
26
-
27
-
28
-
29
-
30
-
31
-
32
-
33
-
34
-
35
-
36
-
37
-
38
-
39
-
40
-
41
-
42
-
43
-
44
-
45
-
46
-
47
-
48
-
49
-
50
-
51
-
52
-
53
-
54
-
55
-
56
-
57
-
58
-
59
-
60
-
61
-
62
-
63
-
64
-
65
-
66
-
67
-
68
-
69
-
70
-
71
-
72
-
73
-
74
-
75
-
76
-
77
-
78
-
79
-
80
-
81
-
82
-
83
-
84
-
85
-
86
-
87
-
88
-
89
-
90
-
91
-
92
-
93
-
94
-
95
-
96
-
97
-
98
-
99
-
100
-
101
-
102
-
103
-
104
-
105
-
106
-
107
-
108
-
109
-
110
-
111
-
112
-
113
-
114
-
115
-
116
-
117
-
118
-
119
-
120
-
121
-
122
-
123
-
124
-
125
-
126
-
127
-
 128
128 -
 129
129 -
 130
130 -
 131
131 -
 132
132 -
 133
133 -
 134
134 -
 135
135 -
 136
136 -
 137
137 -
 138
138 -
 139
139 -
 140
140 -
 141
141 -
 142
142 -
 143
143 -
 144
144 -
 145
145 -
 146
146 -
 147
147 -
 148
148 -
149
-
150
-
151
-
152
-
153
-
154
-
155
-
156
-
157
-
158
-
159
-
160
-
161
-
162
-
163
-
164
-
165
-
166
-
167
-
168
-
169
-
170
-
171
-
172
-
173
-
174
-
175
-
176
-
177
-
178
-
179
-
180
-
181
-
182
-
183
-
184
-
185
-
186
-
187
-
188
-
189
-
190
-
191
-
192
-
193
-
194
-
195
-
196
-
197
-
198
-
199
-
200
 |
 |
HSBC BANK PLC
Notes on the Financial Statements (continued)
136
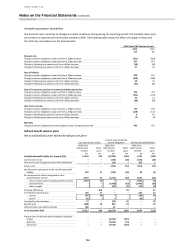
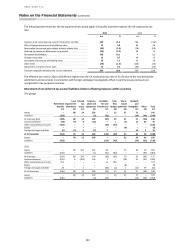
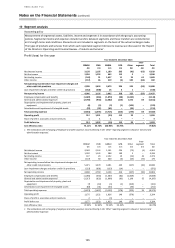
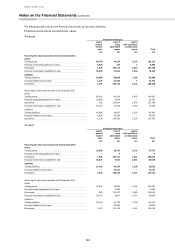
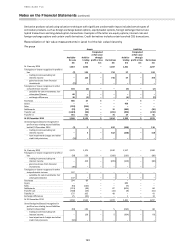
Other information about the profit/(loss) for the year
RBWM
CMB
GB&M
GPB
Other
Inter-
segment
Total
£m
£m
£m
£m
£m
£m
£m
Year ended 31 December 2014
Net operating income:
4,046
3,126
3,695
328
325
(83)
11,437
– external
3,724
3,294
4,401
308
(290)
–
11,437
– inter-segment
322
(168)
(706)
20
615
(83)
–
Year ended 31 December 2013
Net operating income:
4,848
2,769
4,148
316
(157)
(55)
11,869
– external
4,446
3,000
4,631
301
(509)
–
11,869
– inter-segment
402
(231)
(483)
15
352
(55)
–
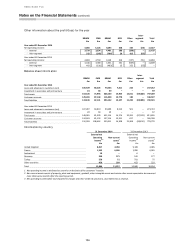
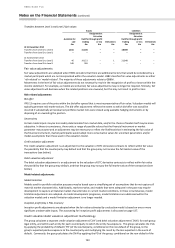
Balance sheet information
RBWM
CMB
GB&M
GPB
Other
Inter-
segment
Total
£m
£m
£m
£m
£m
£m
£m
Year ended 31 December 2014
Loans and advances to customers (net)
105,929
68,225
75,044
7,811
243
–
257,252
Investment in associates and joint venture
21
18
30
–
–
–
69
Total assets
153,325
74,996
608,140
15,905
14,811
(69,888)
797,289
Customer accounts
129,481
87,148
116,558
12,778
182
–
346,507
Total liabilities
143,616
67,141
593,122
15,107
11,493
(69,888)
760,591
Year ended 31 December 2013
Loans and advances to customers (net)
107,287
63,819
93,600
8,515
501
–
273,722
Investment in associates and joint venture
20
18
29
–
–
–
67
Total assets
148,065
81,509
631,114
16,174
22,335
(87,503)
811,695
Customer accounts
124,183
81,133
127,114
13,311
617
–
346,358
Total liabilities
152,599
108,662
555,911
16,108
15,308
(69,812)
778,776
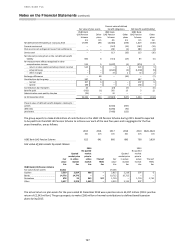
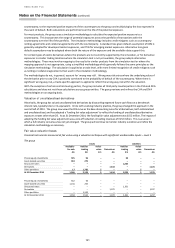
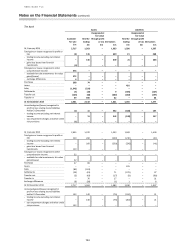
Information by country
31 December 2014
31 December 2013
External net
Operating
income
1, 3
Non-current
assets
2
External net
Operating
income
1,3
Non-current
assets
2
£m
£m
£m
£m
United Kingdom
8,817
4,760
9,149
3,385
France
1,532
6,046
1,990
6,365
Switzerland
10
–
6
–
Germany
509
171
542
177
Turkey
559
71
701
75
Other countries
459
209
452
232
Total
11,886
11,257
12,840
10,234
1 Net operating income is attributed to countries on the basis of the customers’ location.
2 Non-current assets consist of property, plant and equipment, goodwill, other intangible assets and certain other assets expected to be recovered
more than twelve months after the reporting period.
3 Net operating income before loan impairment charges and other credit risk provisions, also referred to as revenue.