HSBC 2014 Annual Report Download - page 81
Download and view the complete annual report
Please find page 81 of the 2014 HSBC annual report below. You can navigate through the pages in the report by either clicking on the pages listed below, or by using the keyword search tool below to find specific information within the annual report.-
 1
1 -
2
-
3
-
4
-
5
-
6
-
7
-
8
-
9
-
10
-
11
-
12
-
13
-
14
-
15
-
16
-
17
-
18
-
19
-
20
-
21
-
22
-
23
-
24
-
25
-
26
-
27
-
28
-
29
-
30
-
31
-
32
-
33
-
34
-
35
-
36
-
37
-
38
-
39
-
40
-
41
-
42
-
43
-
44
-
45
-
46
-
47
-
48
-
49
-
50
-
51
-
52
-
53
-
54
-
55
-
56
-
57
-
58
-
59
-
60
-
61
-
62
-
63
-
64
-
65
-
66
-
67
-
68
-
69
-
70
-
 71
71 -
 72
72 -
 73
73 -
 74
74 -
 75
75 -
 76
76 -
 77
77 -
 78
78 -
 79
79 -
 80
80 -
 81
81 -
 82
82 -
 83
83 -
 84
84 -
 85
85 -
 86
86 -
 87
87 -
 88
88 -
 89
89 -
 90
90 -
 91
91 -
92
-
93
-
94
-
95
-
96
-
97
-
98
-
99
-
100
-
101
-
102
-
103
-
104
-
105
-
106
-
107
-
108
-
109
-
110
-
111
-
112
-
113
-
114
-
115
-
116
-
117
-
118
-
119
-
120
-
121
-
122
-
123
-
124
-
125
-
126
-
127
-
128
-
129
-
130
-
131
-
132
-
133
-
134
-
135
-
136
-
137
-
138
-
139
-
140
-
141
-
142
-
143
-
144
-
145
-
146
-
147
-
148
-
149
-
150
-
151
-
152
-
153
-
154
-
155
-
156
-
157
-
158
-
159
-
160
-
161
-
162
-
163
-
164
-
165
-
166
-
167
-
168
-
169
-
170
-
171
-
172
-
173
-
174
-
175
-
176
-
177
-
178
-
179
-
180
-
181
-
182
-
183
-
184
-
185
-
186
-
187
-
188
-
189
-
190
-
191
-
192
-
193
-
194
-
195
-
196
-
197
-
198
-
199
-
200
 |
 |

HSBC BANK PLC
Report of the Directors: Risk (continued)
79
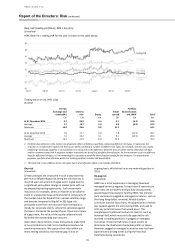
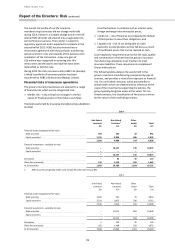
Approximately 60 per cent of financial assets were
invested in debt securities at 31 December 2014 (2013:
54 per cent), with 30 per cent (2013: 38 per cent)
invested in equity securities.
Under unit-linked insurance contracts, premium income
less charges levied is invested in a portfolio of assets. The
group manages the financial risks of this product on
behalf of the policyholders by holding appropriate assets
in segregated funds or portfolios to which the liabilities
are linked. These assets represented 10 per cent of the
total financial assets of the group’s insurance
manufacturing companies at the end of 2014 (2013: 31
per cent).
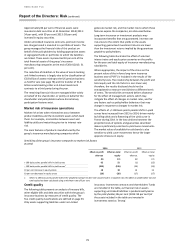
The reduction of £6 billion in the value of assets backing
unit-linked contracts is largely due to the classification of
£3.8 billion of assets relating to the UK pension business
as held for sale (see page 78) and the transfer of £1.8
billion assets backing other unit-linked investment
contracts to a third party during the year.
The remaining financial risks are managed either solely
on behalf of the shareholder, or jointly on behalf of the
shareholder and policyholders where discretionary
participation features exist.
Market risk of insurance operations
Market risk arises when mismatches occur between
product liabilities and the investment assets which back
them. For example, mismatches between asset and
liability yields and maturities give rise to interest rate
risk.
The main features of products manufactured by the
group’s insurance manufacturing companies which
generate market risk, and the market risk to which these
features expose the companies, are discussed below.
Long-term insurance or investment products may
incorporate benefits that are guaranteed. Interest rate
risk arises to the extent that yields on the assets
supporting guaranteed investment returns are lower
than the investment returns implied by the guarantees
payable to policyholders.
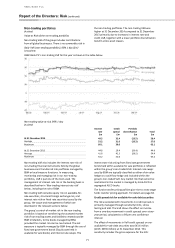
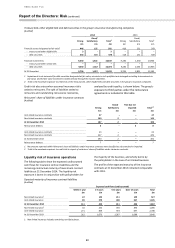
The following table illustrates the effect of selected
interest rates and equity price scenarios on the profits
for the year and total equity of insurance manufacturing
subsidiaries.
Where appropriate, the impact of the stress on the
present value of the in-force long-term insurance
business asset (‘PVIF’) is included in the results of the
sensitivity tests. The relationship between the profit and
total equity and the risk factors is non-linear and,
therefore, the results disclosed should not be
extrapolated to measure sensitivities to different levels
of stress. The sensitivities are stated before allowance
for the effect of management actions which may
mitigate the effect of changes in market rates, and for
any factors such as policyholder behaviour that may
change in response to changes in market risk.
The effects of +/-100 basis points parallel shifts in yield
curves have increased from 2013 to 2014, driven mainly
by falling yields and a flattening of the yield curve in
France during 2014. In the low yield environment the
projected costs of options and guarantees described
above is particularly sensitive to yield curve movements.
The market value of available-for-sale bonds is also
sensitive to yield curve movements hence the larger
opposite stresses on equity.
Sensitivity of the group’s insurance companies to market risk factors
(Audited)
2014
2013
Effect on profit
after tax
Effect on total
equity
Effect on profit
after tax
Effect on total
equity
£m
£m
£m
£m
+ 100 basis points parallel shift in yield curves
62
52
(1)
(12)
– 100 basis points parallel shift in yield curves
1
(205)
(196)
(30)
(19)
10 per cent increase in equity prices
18
18
16
16
10 per cent decrease in equity prices
(20)
(20)
(17)
(17)
1 Where a 100 basis point parallel shift in the weighted average risk free rate would result in a negative rate, the effect on profit before tax and
total equity has been calculated using a minimum rate of 0 per cent.
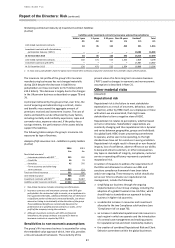
Credit quality
The following table presents an analysis of treasury bills,
other eligible bills and debt securities within the group’s
insurance business by measures of credit quality. The
five credit quality classifications are defined on page 43.
Only assets supporting liabilities under non-linked
insurance, investment contracts and shareholders’ funds
are included in the table, as financial risk on assets
supporting unit-linked liabilities is predominantly borne
by the policyholder; 86 per cent (2013: 84 per cent) of
the assets included in the table are invested in
investments rated as ‘Strong’.