HSBC 2014 Annual Report Download - page 165
Download and view the complete annual report
Please find page 165 of the 2014 HSBC annual report below. You can navigate through the pages in the report by either clicking on the pages listed below, or by using the keyword search tool below to find specific information within the annual report.-
 1
1 -
2
-
3
-
4
-
5
-
6
-
7
-
8
-
9
-
10
-
11
-
12
-
13
-
14
-
15
-
16
-
17
-
18
-
19
-
20
-
21
-
22
-
23
-
24
-
25
-
26
-
27
-
28
-
29
-
30
-
31
-
32
-
33
-
34
-
35
-
36
-
37
-
38
-
39
-
40
-
41
-
42
-
43
-
44
-
45
-
46
-
47
-
48
-
49
-
50
-
51
-
52
-
53
-
54
-
55
-
56
-
57
-
58
-
59
-
60
-
61
-
62
-
63
-
64
-
65
-
66
-
67
-
68
-
69
-
70
-
71
-
72
-
73
-
74
-
75
-
76
-
77
-
78
-
79
-
80
-
81
-
82
-
83
-
84
-
85
-
86
-
87
-
88
-
89
-
90
-
91
-
92
-
93
-
94
-
95
-
96
-
97
-
98
-
99
-
100
-
101
-
102
-
103
-
104
-
105
-
106
-
107
-
108
-
109
-
110
-
111
-
112
-
113
-
114
-
115
-
116
-
117
-
118
-
119
-
120
-
121
-
122
-
123
-
124
-
125
-
126
-
127
-
128
-
129
-
130
-
131
-
132
-
133
-
134
-
135
-
136
-
137
-
138
-
139
-
140
-
141
-
142
-
143
-
144
-
145
-
146
-
147
-
148
-
149
-
150
-
151
-
152
-
153
-
154
-
 155
155 -
 156
156 -
 157
157 -
 158
158 -
 159
159 -
 160
160 -
 161
161 -
 162
162 -
 163
163 -
 164
164 -
 165
165 -
 166
166 -
 167
167 -
 168
168 -
 169
169 -
 170
170 -
 171
171 -
 172
172 -
 173
173 -
 174
174 -
 175
175 -
176
-
177
-
178
-
179
-
180
-
181
-
182
-
183
-
184
-
185
-
186
-
187
-
188
-
189
-
190
-
191
-
192
-
193
-
194
-
195
-
196
-
197
-
198
-
199
-
200
 |
 |

HSBC BANK PLC
Notes on the Financial Statements (continued)
163
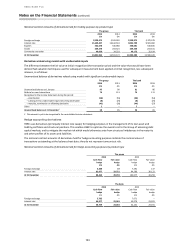
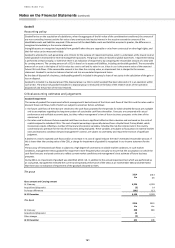
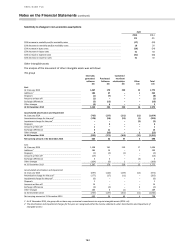
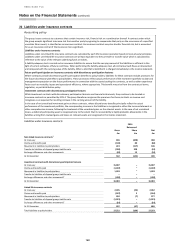
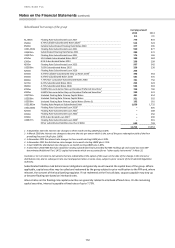
The present value of in-force long-term assurance business
Movement in PVIF
The group
2014
2013
£m
£m
At 1 January
700
705
Addition from current year new business
55
65
Movement from in-force business (including investment return variances and changes in investment
assumptions)
(192)
(76)
Transfer to assets classified as held for sale1
(77)
–
Exchange differences and other movements
(30)
6
At 31 December
456
700
1 The transfer relates to the UK pensions business which was classified as held for sale in the first half of the year.
The group’s life insurance business is accounted for using the embedded value approach which, inter alia, provides a
comprehensive risk and valuation framework. The PVIF asset represents the present value of the shareholders’ interest in
the profits expected to emerge from the book of in-force policies.
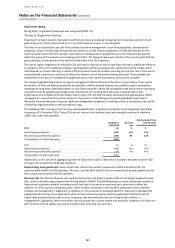
PVIF-specific assumptions
The key assumptions used in the computation of PVIF for the group’s main life insurance operations were:
2014
2013
France1
UK Life
France1
UK Life
Weighted average risk free rate
1.21%
1.65%
2.38%
2.45%
Risk discount rate
1.73%
2.15%
4.69%
2.95%
Expenses inflation
2.00%
4.67%
2.00%
3.39%
1 For 2014, the calculation of France’s PVIF assumes a risk discount rate of 1.73% plus a risk margin of £38 million. For 2013, a composite rate of
4.69% was used. This was equivalent to a weighted average rate of 3.08% plus a risk margin of £41 million.
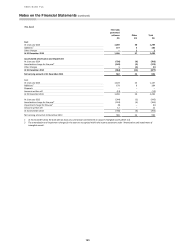
The calculation of the PVIF is based upon assumptions that take into account risk and uncertainty. To project these cash
flows, a variety of assumptions regarding future experience is made by each insurance operation which reflects local
market conditions and management’s judgement of local future trends.
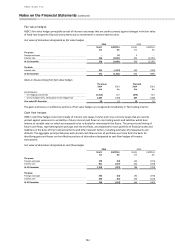
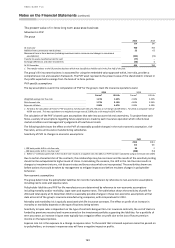
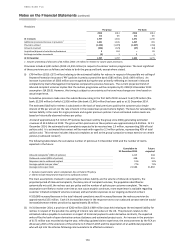
The following table shows the effect on the PVIF of reasonably possible changes in the main economic assumption, risk-
free rates, across all insurance manufacturing subsidiaries.
Sensitivity of PVIF to changes in economic assumptions
PVIF
2014
2013
£m
£m
+ 100 basis points shift in risk-free rate
84
2
– 100 basis points shift in risk-free rate1
(298)
(51)
1 Where a – 100 basis point shift in the risk free rate results in a negative rate, the effect on PVIF has been calculated using a minimum rate of 0%.
Due to certain characteristics of the contracts, the relationships may be non-linear and the results of the sensitivity-testing
should not be extrapolated to higher levels of stress. In calculating the scenario, the shift in the risk-free rate results in
changes to investment returns, risk discount rates and bonus rates which are incorporated. The sensitivities shown are
before actions that could be taken by management to mitigate impacts and before resultant changes in policyholder
behaviour.
Non-economic assumptions
The group determines the policyholder liabilities for non-life manufacturers by reference to non-economic assumptions
including claims costs and expense rates.
Policyholder liabilities and PVIF for life manufacturers are determined by reference to non-economic assumptions
including mortality and/or morbidity, lapse rates and expense rates. The table below shows the sensitivity of profit for
2014 and total equity at 31 December 2014 to reasonably possible changes in these non-economic assumptions at that
date across all of the group’s insurance manufacturing companies, with comparatives for 2013.
Mortality and morbidity risk is typically associated with life insurance contracts. The effect on profit of an increase in
mortality or morbidity depends on the type of business being written.
Sensitivity to lapse rates is dependent on the type of contracts being written. For insurance contracts, the cost of claims is
funded by premiums received and income earned on the investment portfolio supporting the liabilities. For a portfolio of
term assurance, an increase in lapse rates typically has a negative effect on profit due to the loss of future premium
income on the lapsed policies.
Expense rate risk is the exposure to a change in expense rates. To the extent that increased expenses cannot be passed on
to policyholders, an increase in expense rates will have a negative impact on profits.