HSBC 2014 Annual Report Download - page 159
Download and view the complete annual report
Please find page 159 of the 2014 HSBC annual report below. You can navigate through the pages in the report by either clicking on the pages listed below, or by using the keyword search tool below to find specific information within the annual report.-
 1
1 -
2
-
3
-
4
-
5
-
6
-
7
-
8
-
9
-
10
-
11
-
12
-
13
-
14
-
15
-
16
-
17
-
18
-
19
-
20
-
21
-
22
-
23
-
24
-
25
-
26
-
27
-
28
-
29
-
30
-
31
-
32
-
33
-
34
-
35
-
36
-
37
-
38
-
39
-
40
-
41
-
42
-
43
-
44
-
45
-
46
-
47
-
48
-
49
-
50
-
51
-
52
-
53
-
54
-
55
-
56
-
57
-
58
-
59
-
60
-
61
-
62
-
63
-
64
-
65
-
66
-
67
-
68
-
69
-
70
-
71
-
72
-
73
-
74
-
75
-
76
-
77
-
78
-
79
-
80
-
81
-
82
-
83
-
84
-
85
-
86
-
87
-
88
-
89
-
90
-
91
-
92
-
93
-
94
-
95
-
96
-
97
-
98
-
99
-
100
-
101
-
102
-
103
-
104
-
105
-
106
-
107
-
108
-
109
-
110
-
111
-
112
-
113
-
114
-
115
-
116
-
117
-
118
-
119
-
120
-
121
-
122
-
123
-
124
-
125
-
126
-
127
-
128
-
129
-
130
-
131
-
132
-
133
-
134
-
135
-
136
-
137
-
138
-
139
-
140
-
141
-
142
-
143
-
144
-
145
-
146
-
147
-
148
-
 149
149 -
 150
150 -
 151
151 -
 152
152 -
 153
153 -
 154
154 -
 155
155 -
 156
156 -
 157
157 -
 158
158 -
 159
159 -
 160
160 -
 161
161 -
 162
162 -
 163
163 -
 164
164 -
 165
165 -
 166
166 -
 167
167 -
 168
168 -
 169
169 -
170
-
171
-
172
-
173
-
174
-
175
-
176
-
177
-
178
-
179
-
180
-
181
-
182
-
183
-
184
-
185
-
186
-
187
-
188
-
189
-
190
-
191
-
192
-
193
-
194
-
195
-
196
-
197
-
198
-
199
-
200
 |
 |

HSBC BANK PLC
Notes on the Financial Statements (continued)
157
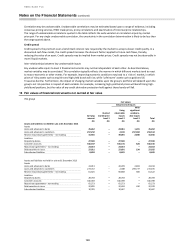
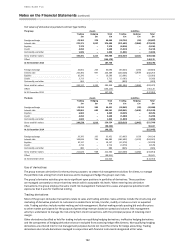
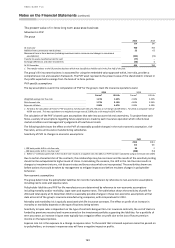
The bank
Carrying
amount of
assets
before
transfer
Carrying
amount of
transferred
assets
Carrying
amount of
associated
liabilities
Fair
value of
transferred
assets
Fair
value of
associated
liabilities
Net
position
£m
£m
£m
£m
£m
At 31 December 2014
Repurchase agreements
16,073
16,674
Securities lending agreements
6,963
5,863
Other sales (recourse to transferred asset only)
389
564
533
533
–
Securitisations recognised to the extent of
continuing involvement
3,590
7
3
7
3
4
At 31 December 2013
Repurchase agreements
34,869
35,676
Securities lending agreements
4,945
4,945
Other sales (recourse to transferred asset only)
581
674
624
624
–
Securitisations recognised to the extent of
continuing involvement
5,021
9
5
9
5
4
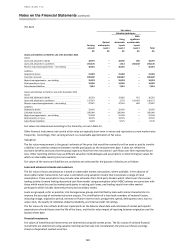
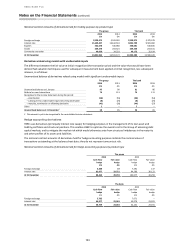
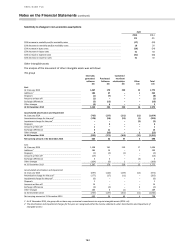
Continuing involvement in financial assets and associated financial liabilities qualifying for full derecognition
The group and the bank
At 31 December
For the year
Carrying amount of
continuing involvement in
statement of financial
position
Fair value of continuing
involvement
Maximum
exposure
to loss
Gain or loss
recognised
at transfer
date
Income/
(expenses)
recognised
in reporting
period
Income/
(expenses)
recognised
cumu
-
latively
Assets
Liabilities
Assets
Liabilities
£m
£m
£m
£m
£m
£m
£m
£m
Interest in SPEs
31 December 2014
98
–
98
–
98
–
–
43
31 December 2013
184
–
186
–
184
6
5
41
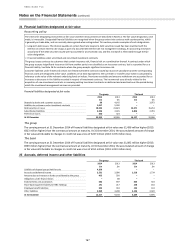
The assets in the table above represent our continuing involvement in securitisations where HSBC has transferred assets
to an unconsolidated SPE, but has retained some of the notes issued by the SPE. These notes are reported in loans and
advances to customers. The maximum exposure to loss is the carrying amount of the notes.
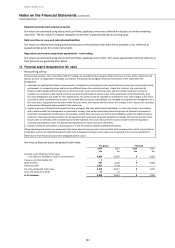
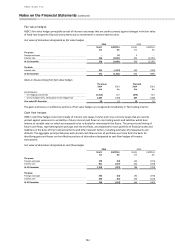
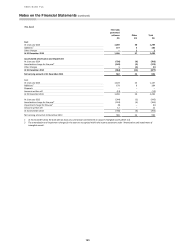
Financial assets pledged to secure liabilities
Group assets pledged at
31 December
Bank assets pledged at
31 December
2014
2013
2014
2013
£m
£m
£m
£m
Treasury bills and other eligible securities
160
1,331
–
–
Loans and advances to banks
9,608
8,309
6,240
5,244
Loans and advances to customers
35,972
44,293
15,061
19,022
Debt securities
53,978
90,675
27,694
51,181
Equity shares
7,051
5,070
6,963
4,945
Other
3,264
72
3,247
–
Assets pledged at 31 December
110,033
149,750
59,205
80,392
The table above shows assets where a charge has been granted to secure liabilities on a legal and contractual basis. The
amount of such assets may be greater than the book value of assets utilised as collateral for funding purposes or to cover
liabilities. This is the case for securitisations and covered bonds where the amount of liabilities issued, plus any mandatory
over-collateralisation, is less than the book value of financial assets available for funding or collateral purposes in the
relevant pool of assets. This is also the case where financial assets are placed with a custodian or settlement agent which
has a floating charge over all the financial assets placed to secure any liabilities under settlement accounts.
These transactions are conducted under terms that are usual and customary to collateralised transactions including,
where relevant, standard securities lending and repurchase agreements.
The financial assets shown above include amounts transferred to third parties that do not qualify for derecognition,
notably debt securities held by counterparties as collateral under repurchase agreements and equity securities lent under
securities lending agreements. As the substance of these transactions is secured borrowings the asset collateral continues
to be recognised in full and the related liability reflecting the Group’s obligation to repurchase the transferred assets for