HSBC 2014 Annual Report Download - page 151
Download and view the complete annual report
Please find page 151 of the 2014 HSBC annual report below. You can navigate through the pages in the report by either clicking on the pages listed below, or by using the keyword search tool below to find specific information within the annual report.-
 1
1 -
2
-
3
-
4
-
5
-
6
-
7
-
8
-
9
-
10
-
11
-
12
-
13
-
14
-
15
-
16
-
17
-
18
-
19
-
20
-
21
-
22
-
23
-
24
-
25
-
26
-
27
-
28
-
29
-
30
-
31
-
32
-
33
-
34
-
35
-
36
-
37
-
38
-
39
-
40
-
41
-
42
-
43
-
44
-
45
-
46
-
47
-
48
-
49
-
50
-
51
-
52
-
53
-
54
-
55
-
56
-
57
-
58
-
59
-
60
-
61
-
62
-
63
-
64
-
65
-
66
-
67
-
68
-
69
-
70
-
71
-
72
-
73
-
74
-
75
-
76
-
77
-
78
-
79
-
80
-
81
-
82
-
83
-
84
-
85
-
86
-
87
-
88
-
89
-
90
-
91
-
92
-
93
-
94
-
95
-
96
-
97
-
98
-
99
-
100
-
101
-
102
-
103
-
104
-
105
-
106
-
107
-
108
-
109
-
110
-
111
-
112
-
113
-
114
-
115
-
116
-
117
-
118
-
119
-
120
-
121
-
122
-
123
-
124
-
125
-
126
-
127
-
128
-
129
-
130
-
131
-
132
-
133
-
134
-
135
-
136
-
137
-
138
-
139
-
140
-
 141
141 -
 142
142 -
 143
143 -
 144
144 -
 145
145 -
 146
146 -
 147
147 -
 148
148 -
 149
149 -
 150
150 -
 151
151 -
 152
152 -
 153
153 -
 154
154 -
 155
155 -
 156
156 -
 157
157 -
 158
158 -
 159
159 -
 160
160 -
 161
161 -
162
-
163
-
164
-
165
-
166
-
167
-
168
-
169
-
170
-
171
-
172
-
173
-
174
-
175
-
176
-
177
-
178
-
179
-
180
-
181
-
182
-
183
-
184
-
185
-
186
-
187
-
188
-
189
-
190
-
191
-
192
-
193
-
194
-
195
-
196
-
197
-
198
-
199
-
200
 |
 |

HSBC BANK PLC
Notes on the Financial Statements (continued)
149
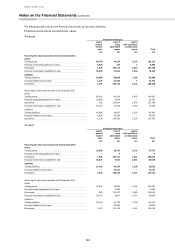
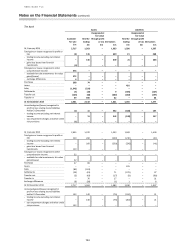
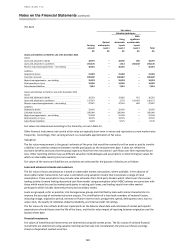
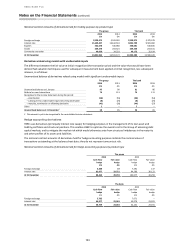
The bank
Fair values
Valuation techniques
Carrying
amount
Quoted
market price
Level 1
Using
observable
inputs
Level 2
With
significant
unobservable
inputs
Level 3
Total
£m
£m
£m
£m
£m
Assets and liabilities not held for sale at 31 December 2014
Assets
Loans and advances to banks
18,776
–
18,536
240
18,776
Loans and advances to customers
201,671
–
1,513
202,632
204,145
Reverse repurchase agreements – non-trading
36,391
–
36,391
–
36,391
Liabilities
Deposits by banks
31,383
–
31,383
–
31,383
Customer accounts
282,687
–
282,687
–
282,687
Repurchase agreements – non-trading
18,293
–
18,293
–
18,293
Debt securities in issue
14,950
–
14,950
–
14,950
Subordinated liabilities
7,854
–
7,654
–
7,654
Assets and liabilities not held for sale at 31 December 2013
Assets
Loans and advances to banks
16,332
–
15,881
451
16,332
Loans and advances to customers
217,567
–
1,732
214,439
216,171
Reverse repurchase agreements – non-trading
47,847
–
47,163
684
47,847
Liabilities
Deposits by banks
32,456
–
32,456
–
32,456
Customer accounts
280,940
–
280,940
–
280,940
Repurchase agreements – non-trading
51,198
–
51,198
–
51,198
Debt securities in issue
19,576
–
19,576
–
19,576
Subordinated liabilities
9,903
–
9,575
–
9,575
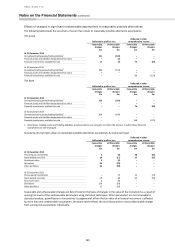
Fair values are determined according to the hierarchy set out in Note 12.
Other financial instruments not carried at fair value are typically short-term in nature and repriced to current market rates
frequently. Accordingly, their carrying amount is a reasonable approximation of fair value.
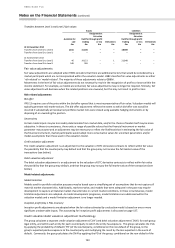
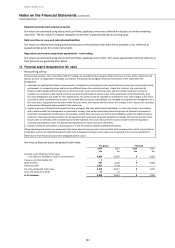
Valuation
The fair value measurement is the group’s estimate of the price that would be received to sell an asset or paid to transfer
a liability in an orderly transaction between market participants at the measurement date. It does not reflect the
economic benefits and costs that the group expects to flow from the instruments’ cash flows over their expected future
lives. Other reporting entities may use different valuation methodologies and assumptions in determining fair values for
which no observable market prices are available.
Fair values of the assets and liabilities set out below are estimated for the purpose of disclosure as follows:
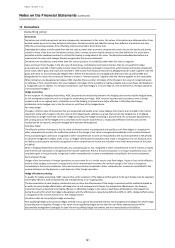
Loans and advances to banks and customers
The fair value of loans and advances is based on observable market transactions, where available. In the absence of
observable market transactions, fair value is estimated using valuation models that incorporate a range of input
assumptions. These assumptions may include value estimates from third party brokers which reflect over-the-counter
trading activity; forward looking discounted cash flow models using assumptions which HSBC believes are consistent with
those which would be used by market participants in valuing such loans; and trading inputs from other market
participants which includes observed primary and secondary trades.
Loans are grouped, as far as possible, into homogeneous groups and stratified by loans with similar characteristics to
improve the accuracy of estimated valuation outputs. The stratification of a loan book considers all material factors,
including vintage, origination period, estimates of future interest rates, prepayment speeds, delinquency rates, loan-to-
value ratios, the quality of collateral, default probability, and internal credit risk ratings.
The fair value of a loan reflects both loan impairments at the balance sheet date and estimates of market participants’
expectations of credit losses over the life of the loans, and the fair value impact of repricing between origination and the
balance sheet date.
Financial investments
Fair values of listed financial investments are determined using bid market prices. The fair values of unlisted financial
investments are determined using valuation techniques that take into consideration the prices and future earnings
streams of equivalent quoted securities.