HSBC 2014 Annual Report Download - page 112
Download and view the complete annual report
Please find page 112 of the 2014 HSBC annual report below. You can navigate through the pages in the report by either clicking on the pages listed below, or by using the keyword search tool below to find specific information within the annual report.-
 1
1 -
2
-
3
-
4
-
5
-
6
-
7
-
8
-
9
-
10
-
11
-
12
-
13
-
14
-
15
-
16
-
17
-
18
-
19
-
20
-
21
-
22
-
23
-
24
-
25
-
26
-
27
-
28
-
29
-
30
-
31
-
32
-
33
-
34
-
35
-
36
-
37
-
38
-
39
-
40
-
41
-
42
-
43
-
44
-
45
-
46
-
47
-
48
-
49
-
50
-
51
-
52
-
53
-
54
-
55
-
56
-
57
-
58
-
59
-
60
-
61
-
62
-
63
-
64
-
65
-
66
-
67
-
68
-
69
-
70
-
71
-
72
-
73
-
74
-
75
-
76
-
77
-
78
-
79
-
80
-
81
-
82
-
83
-
84
-
85
-
86
-
87
-
88
-
89
-
90
-
91
-
92
-
93
-
94
-
95
-
96
-
97
-
98
-
99
-
100
-
101
-
 102
102 -
 103
103 -
 104
104 -
 105
105 -
 106
106 -
 107
107 -
 108
108 -
 109
109 -
 110
110 -
 111
111 -
 112
112 -
 113
113 -
 114
114 -
 115
115 -
 116
116 -
 117
117 -
 118
118 -
 119
119 -
 120
120 -
 121
121 -
 122
122 -
123
-
124
-
125
-
126
-
127
-
128
-
129
-
130
-
131
-
132
-
133
-
134
-
135
-
136
-
137
-
138
-
139
-
140
-
141
-
142
-
143
-
144
-
145
-
146
-
147
-
148
-
149
-
150
-
151
-
152
-
153
-
154
-
155
-
156
-
157
-
158
-
159
-
160
-
161
-
162
-
163
-
164
-
165
-
166
-
167
-
168
-
169
-
170
-
171
-
172
-
173
-
174
-
175
-
176
-
177
-
178
-
179
-
180
-
181
-
182
-
183
-
184
-
185
-
186
-
187
-
188
-
189
-
190
-
191
-
192
-
193
-
194
-
195
-
196
-
197
-
198
-
199
-
200
 |
 |

HSBC BANK PLC
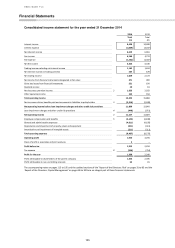
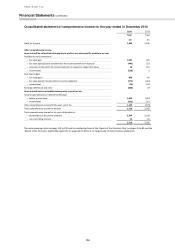
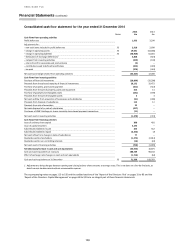
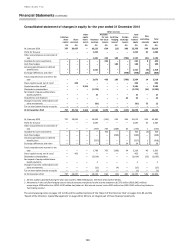
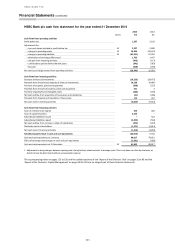
Financial Statements (continued)
110
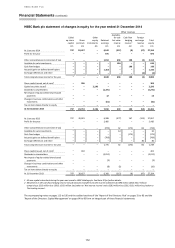
HSBC Bank plc statement of financial position at 31 December 2014
2014
2013
Notes
£m
£m
Assets
Cash and balances at central banks
41,424
60,996
Items in the course of collection from other banks
630
1,374
Trading assets
11
97,757
101,287
Financial assets designated at fair value
14
9
3,983
Derivatives
15
160,232
112,623
Loans and advances to banks
29
18,776
16,332
Loans and advances to customers
29
201,671
217,567
Reverse repurchase agreements – non-trading
16
36,391
47,847
Financial investments
17
48,438
45,048
Prepayments, accrued income and other assets
19
12,908
8,201
Current tax assets
125
424
Interests in associates and joint ventures
20
62
62
Investments in subsidiary undertakings
22
11,339
11,206
Goodwill and intangible assets
21
948
891
Deferred tax assets
8
5
88
Total assets
630,715
627,929
Liabilities and equity
Liabilities
Deposits by banks
29
31,383
32,456
Customer accounts
29
282,687
280,940
Repurchase agreements – non-trading
16
18,293
51,198
Items in the course of transmission to other banks
336
422
Trading liabilities
23
59,039
62,414
Financial liabilities designated at fair value
24
16,127
22,006
Derivatives
15
161,442
114,710
Debt securities in issue
29
14,950
19,576
Accruals, deferred income and other liabilities
25
5,289
5,695
Current tax liabilities
160
142
Provisions
27
1,345
1,271
Deferred tax liabilities
8
345
2
Subordinated liabilities
28
7,854
9,903
Total liabilities
599,250
600,735
Equity
Called up share capital
32
797
797
Share premium account
20,733
20,427
Other equity instruments
32
2,196
-
Other reserves
389
(372)
Retained earnings
7,350
6,342
Total equity
31,465
27,194
Total equity and liabilities
630,715
627,929
The accompanying notes on pages 113 to 195 and the audited sections of the ‘Report of the Directors: Risk’ on pages 31 to 83 and the
‘Report of the Directors: Capital Management’ on pages 84 to 93 form an integral part of these financial statements.
A P S Simoes, Director 23 February 2015