HSBC 2014 Annual Report Download - page 45
Download and view the complete annual report
Please find page 45 of the 2014 HSBC annual report below. You can navigate through the pages in the report by either clicking on the pages listed below, or by using the keyword search tool below to find specific information within the annual report.-
 1
1 -
2
-
3
-
4
-
5
-
6
-
7
-
8
-
9
-
10
-
11
-
12
-
13
-
14
-
15
-
16
-
17
-
18
-
19
-
20
-
21
-
22
-
23
-
24
-
25
-
26
-
27
-
28
-
29
-
30
-
31
-
32
-
33
-
34
-
 35
35 -
 36
36 -
 37
37 -
 38
38 -
 39
39 -
 40
40 -
 41
41 -
 42
42 -
 43
43 -
 44
44 -
 45
45 -
 46
46 -
 47
47 -
 48
48 -
 49
49 -
 50
50 -
 51
51 -
 52
52 -
 53
53 -
 54
54 -
 55
55 -
56
-
57
-
58
-
59
-
60
-
61
-
62
-
63
-
64
-
65
-
66
-
67
-
68
-
69
-
70
-
71
-
72
-
73
-
74
-
75
-
76
-
77
-
78
-
79
-
80
-
81
-
82
-
83
-
84
-
85
-
86
-
87
-
88
-
89
-
90
-
91
-
92
-
93
-
94
-
95
-
96
-
97
-
98
-
99
-
100
-
101
-
102
-
103
-
104
-
105
-
106
-
107
-
108
-
109
-
110
-
111
-
112
-
113
-
114
-
115
-
116
-
117
-
118
-
119
-
120
-
121
-
122
-
123
-
124
-
125
-
126
-
127
-
128
-
129
-
130
-
131
-
132
-
133
-
134
-
135
-
136
-
137
-
138
-
139
-
140
-
141
-
142
-
143
-
144
-
145
-
146
-
147
-
148
-
149
-
150
-
151
-
152
-
153
-
154
-
155
-
156
-
157
-
158
-
159
-
160
-
161
-
162
-
163
-
164
-
165
-
166
-
167
-
168
-
169
-
170
-
171
-
172
-
173
-
174
-
175
-
176
-
177
-
178
-
179
-
180
-
181
-
182
-
183
-
184
-
185
-
186
-
187
-
188
-
189
-
190
-
191
-
192
-
193
-
194
-
195
-
196
-
197
-
198
-
199
-
200
 |
 |

HSBC BANK PLC
Report of the Directors: Risk (continued)
43
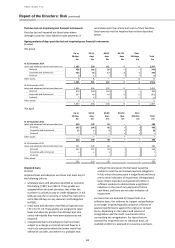
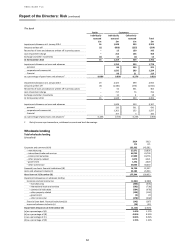
Credit quality of financial instruments
(Audited)
The five credit quality classifications defined below each
encompass a range of more granular, internal credit
rating grades assigned to wholesale and retail lending
business, as well as the external rating,
attributed by external agencies to debt securities. There
is no direct correlation between the internal and external
ratings at granular level, except to the extent each falls
within a single quality classification.
Credit quality
Debt securities
and other bills
Wholesale lending and derivatives Retail lending
Quality classification
External credit
rating
Internal credit
rating
Probability of
default %
Internal credit rating
Expected loss %
Strong
A- and above
CRR1 to CRR2
0 – 0.169
EL1 to EL2
0 – 0.999
Good
BBB+ to BBB-
CRR3
0.170 – 0.740
EL3
1.000 – 4.999
Satisfactory
BB+ to B and unrated
CRR4 to CRR5
0.741 – 4.914
EL4 to EL5
5.000 – 19.999
Sub – standard
B- and below
CRR6 to CRR8
4.915 – 99.999
EL6 to EL8
20.000 – 99.999
Impaired
Impaired
CRR9 to CRR10
100
EL9 to EL10
100+ or defaulted1
1 The EL percentage is derived through a combination of Probability of Default (‘PD’) and Loss Given Default (‘LGD’) and may exceed 100 per cent
in circumstances where the LGD is above 100 per cent reflecting the cost of recoveries.
Quality classification definitions
(Audited)
‘Strong’: Exposures demonstrate a strong capacity to
meet financial commitments, with negligible or low
probability of default and/or low levels of expected loss.
Retail accounts operate within product parameters and
only exceptionally show any period of delinquency.
‘Good’: Exposures require closer monitoring and
demonstrate a good capacity to meet financial
commitments, with low default risk. Retail accounts
typically show only short periods of delinquency, with
any losses expected to be minimal following the
adoption of recovery processes.
‘Satisfactory’: Exposures require closer monitoring and
demonstrate an average to fair capacity to meet financial
commitments, with moderate default risk. Retail
accounts typically show only short periods of
delinquency, with any losses expected to be minor
following the adoption of recovery processes.
‘Sub-standard’: Exposures require varying degrees of
special attention and default risk is of greater concern.
Retail portfolio segments show longer delinquency
periods of generally up to 90 days past due and/or
expected losses are higher due to a reduced ability to
mitigate these through security realisation or other
recovery processes.
‘Impaired’: Exposures have been assessed, individually or
collectively, as impaired.
Risk rating scales
(Audited)
The Customer Risk Rating (‘CRR’) 10-grade scale above
summarises a more granular underlying 23-grade scale
of obligor probability of default (‘PD’).
All distinct HSBC customers are rated using one of these
two PD scales, depending on the degree of sophistication
of the Basel II approach adopted for the exposure.
Each CRR band is associated with an external rating
grade by reference to long-run default rates for that
grade, represented by the average of issuer-weighted
historical default rates. This mapping between internal
and external ratings is indicative and may vary over time.
The Expected Loss (‘EL’) 10-grade scale for retail business
summarises a more granular underlying EL scale for
these customer segments; this combines obligor and
facility/product risk factors in a composite measure.
For debt securities and certain other financial
instruments, external ratings have been aligned to the
five quality classifications. The most recent mapping
review resulted in ‘B‘ being mapped to CRR5. Accordingly
‘B‘ ratings are now mapped to ‘Satisfactory’. This
represents a changes in disclosure mapping unrelated to
changes in counterparty creditworthiness.
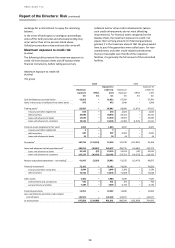
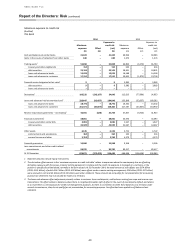
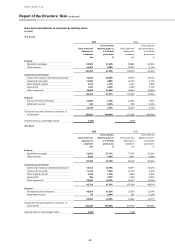
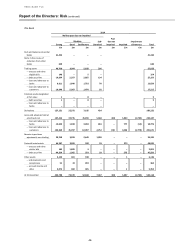
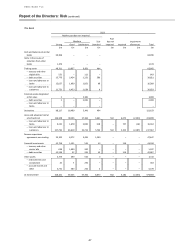
For the purpose of the following disclosure, retail loans
which are past due up to 89 days and are not otherwise
classified as EL9 or EL10, are not disclosed within the EL
grade to which they relate, but are separately classified
as past due but not impaired. The following tables set
out the group’s distribution of financial instruments by
measures of credit quality.