HSBC 2014 Annual Report Download - page 166
Download and view the complete annual report
Please find page 166 of the 2014 HSBC annual report below. You can navigate through the pages in the report by either clicking on the pages listed below, or by using the keyword search tool below to find specific information within the annual report.-
 1
1 -
2
-
3
-
4
-
5
-
6
-
7
-
8
-
9
-
10
-
11
-
12
-
13
-
14
-
15
-
16
-
17
-
18
-
19
-
20
-
21
-
22
-
23
-
24
-
25
-
26
-
27
-
28
-
29
-
30
-
31
-
32
-
33
-
34
-
35
-
36
-
37
-
38
-
39
-
40
-
41
-
42
-
43
-
44
-
45
-
46
-
47
-
48
-
49
-
50
-
51
-
52
-
53
-
54
-
55
-
56
-
57
-
58
-
59
-
60
-
61
-
62
-
63
-
64
-
65
-
66
-
67
-
68
-
69
-
70
-
71
-
72
-
73
-
74
-
75
-
76
-
77
-
78
-
79
-
80
-
81
-
82
-
83
-
84
-
85
-
86
-
87
-
88
-
89
-
90
-
91
-
92
-
93
-
94
-
95
-
96
-
97
-
98
-
99
-
100
-
101
-
102
-
103
-
104
-
105
-
106
-
107
-
108
-
109
-
110
-
111
-
112
-
113
-
114
-
115
-
116
-
117
-
118
-
119
-
120
-
121
-
122
-
123
-
124
-
125
-
126
-
127
-
128
-
129
-
130
-
131
-
132
-
133
-
134
-
135
-
136
-
137
-
138
-
139
-
140
-
141
-
142
-
143
-
144
-
145
-
146
-
147
-
148
-
149
-
150
-
151
-
152
-
153
-
154
-
155
-
 156
156 -
 157
157 -
 158
158 -
 159
159 -
 160
160 -
 161
161 -
 162
162 -
 163
163 -
 164
164 -
 165
165 -
 166
166 -
 167
167 -
 168
168 -
 169
169 -
 170
170 -
 171
171 -
 172
172 -
 173
173 -
 174
174 -
 175
175 -
 176
176 -
177
-
178
-
179
-
180
-
181
-
182
-
183
-
184
-
185
-
186
-
187
-
188
-
189
-
190
-
191
-
192
-
193
-
194
-
195
-
196
-
197
-
198
-
199
-
200
 |
 |
HSBC BANK PLC
Notes on the Financial Statements (continued)
164
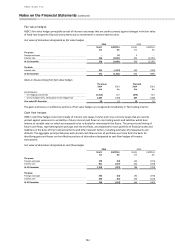
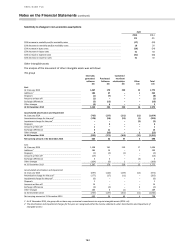
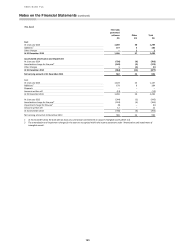
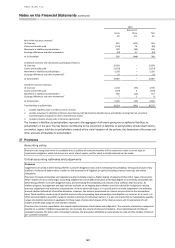
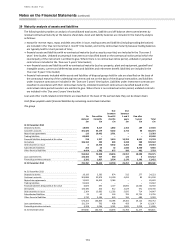
Sensitivity to changes in non-economic assumptions
PVIF
2014
2013
£m
£m
10% increase in mortality and/or morbidity rates
(17)
(20)
10% decrease in mortality and/or morbidity rates
18
20
10% increase in lapse rates
(29)
(34)
10% decrease in lapse rates
31
38
10% increase in expense rates
(31)
(30)
10% decrease in expense rates
31
30
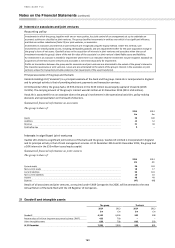
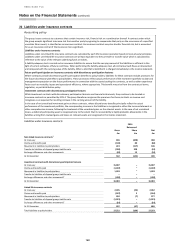
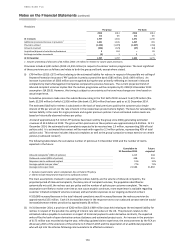
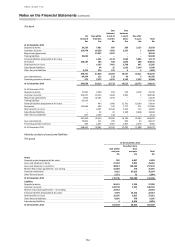
Other intangible assets
The analysis of the movement of other intangible assets was as follows:
The group
Internally
generated
software
Purchased
Software
Customer/
merchant
relationships
Other
Total
£m
£m
£m
£m
£m
Cost
At 1 January 2014
1,367
170
220
15
1,772
Additions1
184
47
–
1
232
Disposals
(1)
(7)
–
–
(8)
Amounts written off
(1)
–
–
–
(1)
Exchange differences
(5)
(13)
–
–
(18)
Other changes
(4)
6
–
–
2
At 31 December 2014
1,540
203
220
16
1,979
Accumulated amortisation and impairment
At 1 January 2014
(765)
(137)
(151)
(11)
(1,064)
Amortisation charge for the year2
(178)
(18)
(12)
(1)
(209)
Impairment charge for the year2
–
–
–
(2)
(2)
Disposals
–
6
–
–
6
Amounts written off
1
–
–
–
1
Exchange differences
3
11
–
–
14
Other changes
4
(33)
–
2
(27)
At 31 December 2014
(935)
(171)
(163)
(12)
(1,281)
Net carrying amount at 31 December 2014
605
32
57
4
698
Cost
At 1 January 2013
1,298
161
220
17
1,696
Additions1
184
14
–
1
199
Disposals
(1)
(2)
(1)
–
(4)
Amounts written off
(13)
–
–
–
(13)
Exchange differences
3
3
–
(3)
3
Other changes
(104)
(6)
1
–
(109)
At 31 December 2013
1,367
170
220
15
1,772
Accumulated amortisation and impairment
At 1 January 2013
(697)
(124)
(139)
(14)
(974)
Amortisation charge for the year2
(177)
(17)
(11)
–
(205)
Impairment charge for the year2
(6)
–
–
–
(6)
Disposals
1
–
–
–
1
Amounts written off
13
–
–
–
13
Exchange differences
(3)
(2)
–
3
(2)
Other changes
104
6
(1)
–
109
At 31 December 2013
(765)
(137)
(151)
(11)
(1,064)
Net carrying amount at 31 December 2013
602
33
69
4
708
1 At 31 December 2014, the group did not have any contractual commitments to acquire intangible assets (2013: nil).
2 The amortisation and impairment charges for the year are recognised within the income statement under ‘Amortisation and impairment of
intangible assets’.