Volvo 2009 Annual Report Download - page 99
Download and view the complete annual report
Please find page 99 of the 2009 Volvo annual report below. You can navigate through the pages in the report by either clicking on the pages listed below, or by using the keyword search tool below to find specific information within the annual report.-
 1
1 -
2
-
3
-
4
-
5
-
6
-
7
-
8
-
9
-
10
-
11
-
12
-
13
-
14
-
15
-
16
-
17
-
18
-
19
-
20
-
21
-
22
-
23
-
24
-
25
-
26
-
27
-
28
-
29
-
30
-
31
-
32
-
33
-
34
-
35
-
36
-
37
-
38
-
39
-
40
-
41
-
42
-
43
-
44
-
45
-
46
-
47
-
48
-
49
-
50
-
51
-
52
-
53
-
54
-
55
-
56
-
57
-
58
-
59
-
60
-
61
-
62
-
63
-
64
-
65
-
66
-
67
-
68
-
69
-
70
-
71
-
72
-
73
-
74
-
75
-
76
-
77
-
78
-
79
-
80
-
81
-
82
-
83
-
84
-
85
-
86
-
87
-
88
-
 89
89 -
 90
90 -
 91
91 -
 92
92 -
 93
93 -
 94
94 -
 95
95 -
 96
96 -
 97
97 -
 98
98 -
 99
99 -
 100
100 -
 101
101 -
 102
102 -
 103
103 -
 104
104 -
 105
105 -
 106
106 -
 107
107 -
 108
108 -
 109
109 -
110
-
111
-
112
-
113
-
114
-
115
-
116
-
117
-
118
-
119
-
120
-
121
-
122
-
123
-
124
-
125
-
126
-
127
-
128
-
129
-
130
-
131
-
132
-
133
-
134
-
135
-
136
-
137
-
138
-
139
-
140
-
141
-
142
-
143
-
144
-
145
-
146
 |
 |

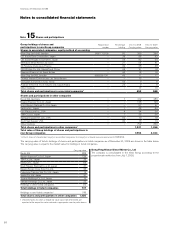
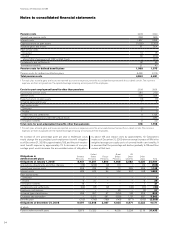
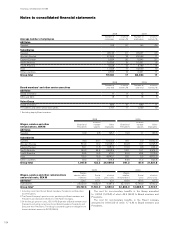
Fair value of plan assets in
funded plans Sweden
Pensions
United
States
Pensions France
Pensions
Great
Britain
Pensions
US
Other
benefits Other
plans Total
Plan assets at January 1, 2008 6,648 12,195 –4,911 136 1,878 25,768
Acquisitions, divestments and other changes –(180) –95 – 1 (84)
Expected return on plan assets 397 886 –275 397 1,658
Actuarial gains and (losses) (1,578) (3,695) –(715) –(220) (6,208)
Employer contributions – – – 147 10 147 304
Employee contributions – – – 29 –33 62
Exchange rate translation –2,226 –(609) 18 64 1,699
Benefits paid –(760) –(141) (63) (130) (1,094)
Plan assets at December 31, 2008 5,467 10,672 –3,992 104 1,870 22,105
Acquisitions, divestments and other changes –(3) –––(141) (144)
Expected return on plan assets 328 717 –223 189 1,358
Actuarial gains and (losses) 635 644 –141 –43 1,463
Employer contributions – – – 113 –167 280
Employee contributions – – – 24 –20 44
Exchange rate translation –(1,203) –72 (3) 36 (1,098)
Benefits paid –(961) –(173) (74) (190) (1,398)
whereof reclassification to financial liability in Mack Trucks – – – (73) – (73)
Plan assets at December 31, 2009 6,430 9,866 –4,392 28 1,894 22,610
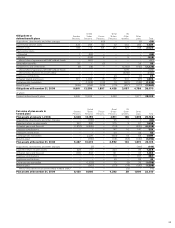
Obligations in
defined benefit plans Sweden
Pensions
United
States
Pensions France
Pensions
Great
Britain
Pensions
US
Other
benefits Other
plans Total
Acquisitions, divestments and other changes – – (53) – – (3) (56)
Current year service costs 323 264 65 52 252 283 1,239
Interest costs 414 774 104 242 328 168 2,030
Past service costs
– Unvested 1(90) – – – – (89)
– Vested –(316) 3 – 5 – (308)
whereof effect of agreement with UAW in Mack Trucks -(317) – – – – (317)
Termination benefits 32 –(1) – – 25 56
Curtailments and settlements (8) (18) – – (3,163) (140) (3,329)
whereof effect of agreement with UAW in Mack Trucks 1,194 1,194
whereof reclassification to financial liability – – – – (4,282) –(4,282)
Employee contributions – – – 24 –(1) 23
Actuarial (gains) and losses 321 1,096 18 187 231 (47) 1,806
Exchange rate translation –(1,008) (110) 73 (320) (148) (1,513)
Benefits paid (299) (992) (216) (175) (607) (671) (2,960)
Obligations at December 31, 2009 9,881 13,358 1,897 4,438 3,697 4,799 38,070
of which
Funded defined benefit plans 9,465 12,923 –4,438 –2,277 29,103
95