Volvo 2009 Annual Report Download - page 30
Download and view the complete annual report
Please find page 30 of the 2009 Volvo annual report below. You can navigate through the pages in the report by either clicking on the pages listed below, or by using the keyword search tool below to find specific information within the annual report.-
 1
1 -
2
-
3
-
4
-
5
-
6
-
7
-
8
-
9
-
10
-
11
-
12
-
13
-
14
-
15
-
16
-
17
-
18
-
19
-
 20
20 -
 21
21 -
 22
22 -
 23
23 -
 24
24 -
 25
25 -
 26
26 -
 27
27 -
 28
28 -
 29
29 -
 30
30 -
 31
31 -
 32
32 -
 33
33 -
 34
34 -
 35
35 -
 36
36 -
 37
37 -
 38
38 -
 39
39 -
 40
40 -
41
-
42
-
43
-
44
-
45
-
46
-
47
-
48
-
49
-
50
-
51
-
52
-
53
-
54
-
55
-
56
-
57
-
58
-
59
-
60
-
61
-
62
-
63
-
64
-
65
-
66
-
67
-
68
-
69
-
70
-
71
-
72
-
73
-
74
-
75
-
76
-
77
-
78
-
79
-
80
-
81
-
82
-
83
-
84
-
85
-
86
-
87
-
88
-
89
-
90
-
91
-
92
-
93
-
94
-
95
-
96
-
97
-
98
-
99
-
100
-
101
-
102
-
103
-
104
-
105
-
106
-
107
-
108
-
109
-
110
-
111
-
112
-
113
-
114
-
115
-
116
-
117
-
118
-
119
-
120
-
121
-
122
-
123
-
124
-
125
-
126
-
127
-
128
-
129
-
130
-
131
-
132
-
133
-
134
-
135
-
136
-
137
-
138
-
139
-
140
-
141
-
142
-
143
-
144
-
145
-
146
 |
 |

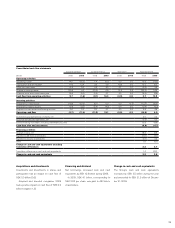
BOARD OF DIRECTORS’ REPORT 2009
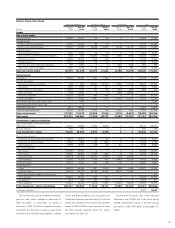
Net financial position
Industrial operations Volvo Group
SEK M Dec 31
2008
Dec 31
2009
Dec 31
2008
Dec 31
2009
Non-current interest-bearing assets
Non-current customer-nancing receivables – – 50,432 39,713
Non-current interest-bearing receivables 149 1,095 694 585
Current interest-bearing assets
Customer-nancing receivables – – 48,057 42,264
Interest-bearing receivables 2,684 1,215 1,965 410
Internal funding 792 3,662 – –
Interest-bearing assets held for sale – 8 – 8
Marketable securities 5,901 16,655 5,902 16,676
Cash and bank 16 ,674 20,749 17,712 21,234
Total financial assets 26,200 43,384 124,762 120,890
Non-current interest-bearing liabilities
Bond loans 35,798 49,191 35,798 49,191
Other loans 39,880 48,684 47,298 56,035
Internal funding (44,934) (30,908) – –
Current interest-bearing liabilities
Loans 56,178 44,196 62,631 51,626
Internal funding (40,173) (32,273) – –
Total financial liabilities 46,749 78,890 145,727 156,852
Net financial position excl.
post employment benefits (20,549) (35,506) (20,965) (35,962)
Provision for post employment benets, net 9,246 5,983 9,263 6,002
Net financial position incl.
post employment benefits (29,795) (41,489) (30,228) (41,964)
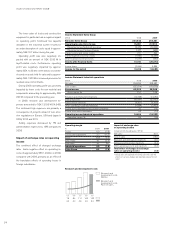
Change in net financial position, Industrial operations
SEK bn 2008 2009
Beginning of period (4.3) (29.8)
Cash flow from operating activities 9.7 (1.6)
Investments in xed assets (13.0) (10.5)
Disposals 0.6 0.7
Operating cash-flow (2.7) (11.4)
Investments and divestments of shares 0.0 0.0
Acquired and divested operations, net (1.3) 0.2
Capital injections to/from Customer Finance operations (0.2) 0.4
Currency effect (9.1) 3.0
Payment to AB Volvo shareholders (11.1) (4.1)
Revaluation of loans (0.9) 0.9
Provision UAW agreement – (0.9)
Other (0.2) 0.2
Total change (25.5) (11.7)
Net financial position at end of period (29.8) (41.5)
Volvo Group’s liquid funds, cash and cash
equivalents and marketable securities com-
bined, amounted to SEK 37.9 billion on
December 31, 2009. Of this, SEK 1.2 billion
was restricted for use by the Volvo Group and
SEK 5.3 billion consisted of liquid funds in
countries where exchange controls or other
legal restrictions apply. In addition to this,
granted but unutilized credit facilities amounted
to SEK 33.2 billion.
Total assets in the Volvo Group amounted to
SEK 332.3 billion on December 31, 2009, a
decrease of SEK 40.2 billion compared to year-
end 2008. The decrease is mainly the result of
lower working capital due to decreased inven-
tories and accounts receivable, decreased cus-
tomer nancing receivables due to lower levels of
nancial leasing, installment credits and dealer
nancing as well as uctuations in currency. Fluc-
tuations in currency decreased the Volvo Group’s
total assets by SEK 8.3 billion during 2009.
Volvo Group’s intangible assets amounted to
SEK 41.6 billion on December 31, 2009. Invest-
ments in research and development amounted to
SEK 2.6 billion in 2009, resulting in a net value of
development costs of SEK 11.4 billion at the end
of the year. Volvo Group’s total goodwill amounted
to SEK 23.8 billion on December 31, 2009, a
decrease by SEK 1.0 billion compared to year-
end 2008. The decrease is a result of fluctu ations
in currency. The Volvo Group’s tangible assets
decreased by SEK 7.0 billion during 2009, mainly
as a result of decreased assets under operational
leasing.
The value of the Volvo Group’s inventories
decreased by SEK 17.3 billion during 2009. The
decrease is mainly related to nished products
within the Group’s truck brands and construction
equipment. Currency fluctuations only had a
minor impact on the value of inventories at the
end of 2009.
Financial position
– increased debt but continued
strong liquidity position
Net debt in the Volvo Group’s Industrial Operations amounted to SEK 41.5 billion at December
31, 2009, equal to 70.9% of shareholders’ equity. Excluding provisions for post-employment
benets the Volvo Group’s net debt amounted to SEK 35.5 billion, which was equal to 60.7%
of shareholders’ equity.
26