Volvo 2009 Annual Report Download - page 127
Download and view the complete annual report
Please find page 127 of the 2009 Volvo annual report below. You can navigate through the pages in the report by either clicking on the pages listed below, or by using the keyword search tool below to find specific information within the annual report.-
 1
1 -
2
-
3
-
4
-
5
-
6
-
7
-
8
-
9
-
10
-
11
-
12
-
13
-
14
-
15
-
16
-
17
-
18
-
19
-
20
-
21
-
22
-
23
-
24
-
25
-
26
-
27
-
28
-
29
-
30
-
31
-
32
-
33
-
34
-
35
-
36
-
37
-
38
-
39
-
40
-
41
-
42
-
43
-
44
-
45
-
46
-
47
-
48
-
49
-
50
-
51
-
52
-
53
-
54
-
55
-
56
-
57
-
58
-
59
-
60
-
61
-
62
-
63
-
64
-
65
-
66
-
67
-
68
-
69
-
70
-
71
-
72
-
73
-
74
-
75
-
76
-
77
-
78
-
79
-
80
-
81
-
82
-
83
-
84
-
85
-
86
-
87
-
88
-
89
-
90
-
91
-
92
-
93
-
94
-
95
-
96
-
97
-
98
-
99
-
100
-
101
-
102
-
103
-
104
-
105
-
106
-
107
-
108
-
109
-
110
-
111
-
112
-
113
-
114
-
115
-
116
-
 117
117 -
 118
118 -
 119
119 -
 120
120 -
 121
121 -
 122
122 -
 123
123 -
 124
124 -
 125
125 -
 126
126 -
 127
127 -
 128
128 -
 129
129 -
 130
130 -
 131
131 -
 132
132 -
 133
133 -
 134
134 -
 135
135 -
 136
136 -
 137
137 -
138
-
139
-
140
-
141
-
142
-
143
-
144
-
145
-
146
 |
 |

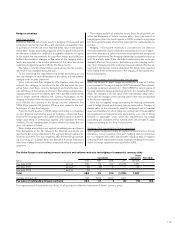
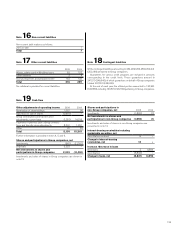
Note 16 Non-current liabilities
Note 18 Contingent liabilities
Note 17 Other current liabilities
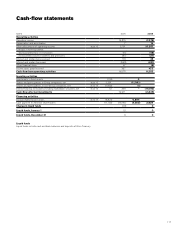
Note 19 Cash-flow
Non-current debt matures as follows:
2015 or later 7
Total 7
Of the contingent liabilities amounting to 254,299 (253,489), 254,041
(253,186) pertained to Group companies.
Guarantees for various credit programs are included in amounts
corresponding to the credit limits. These guarantees amount to
247,010 (246,646), of which guarantees on behalf of Group companies
totaled 247,010 (246,536).
At the end of each year, the utilized portion amounted to 130,961
(126,880), including 130,872 (126,762) pertaining to Group companies.
2008 2009
Wages, salaries and withholding taxes 62 102
Other liabilities 2 4
Accrued expenses and prepaid income 152 133
Total 216 239
No collateral is provided for current liabilities.
Other adjustments of operating income 2008 2009
Revaluation of shareholdings 1,061 (4)
Gain/loss on sale of shares (2,661) –
Group contributions and transfer price
adjustments, current year (1,351) 14,016
Payments of previous years Group contribu-
tions and transfer price adjustments 8,061 1,351
Other 81 (2)
Total 5,191 15,361
Further information is provided in notes 4, 5 and 6.
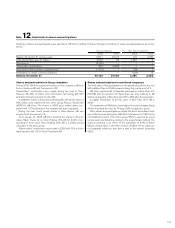
Shares and participations in Group companies, net
Investments (841) (11, 0 91)
Disposals 3,232 –
Net investments in shares and
participations in Group companies 2,391 (11,091)
Investments and sales of shares in Group companies are shown in
note 12.
Shares and participations in
non-Group companies, net 2008 2009
Investments (1,892) (1)
Net investments in shares and
participations in non-Group companies (1,892) (1)
Investments and sales of shares in non-Group companies are
presented in note 12.
Interest-bearing receivables including
marketable securities, net
Amortization received 13 –
Change in interest-bearing
receivables, net 13 –
Increase /decrease in loans
New loans 26,894
Amortization (8,833) –
Change in loans, net (8,831) 6,894
123