Volvo 2009 Annual Report Download - page 98
Download and view the complete annual report
Please find page 98 of the 2009 Volvo annual report below. You can navigate through the pages in the report by either clicking on the pages listed below, or by using the keyword search tool below to find specific information within the annual report.-
 1
1 -
2
-
3
-
4
-
5
-
6
-
7
-
8
-
9
-
10
-
11
-
12
-
13
-
14
-
15
-
16
-
17
-
18
-
19
-
20
-
21
-
22
-
23
-
24
-
25
-
26
-
27
-
28
-
29
-
30
-
31
-
32
-
33
-
34
-
35
-
36
-
37
-
38
-
39
-
40
-
41
-
42
-
43
-
44
-
45
-
46
-
47
-
48
-
49
-
50
-
51
-
52
-
53
-
54
-
55
-
56
-
57
-
58
-
59
-
60
-
61
-
62
-
63
-
64
-
65
-
66
-
67
-
68
-
69
-
70
-
71
-
72
-
73
-
74
-
75
-
76
-
77
-
78
-
79
-
80
-
81
-
82
-
83
-
84
-
85
-
86
-
87
-
 88
88 -
 89
89 -
 90
90 -
 91
91 -
 92
92 -
 93
93 -
 94
94 -
 95
95 -
 96
96 -
 97
97 -
 98
98 -
 99
99 -
 100
100 -
 101
101 -
 102
102 -
 103
103 -
 104
104 -
 105
105 -
 106
106 -
 107
107 -
 108
108 -
109
-
110
-
111
-
112
-
113
-
114
-
115
-
116
-
117
-
118
-
119
-
120
-
121
-
122
-
123
-
124
-
125
-
126
-
127
-
128
-
129
-
130
-
131
-
132
-
133
-
134
-
135
-
136
-
137
-
138
-
139
-
140
-
141
-
142
-
143
-
144
-
145
-
146
 |
 |

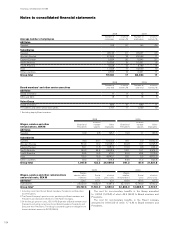
Notes to consolidated financial statements
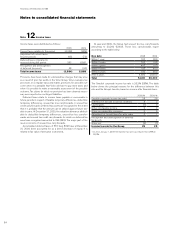
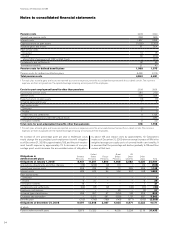
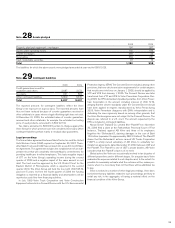
Pension costs 2008 2009
Current year service costs 864 969
Interest costs 1,557 1,684
Expected return on plan assets (1,655) (1,362)
Actuarial gains and losses181 504
Past service costs
– Unvested 14 18
– Vested 39 (314)
whereof effect of agreement with UAW in Mack Trucks –(317)
Curtailments and settlements 167 36
Termination benefits 21 40
Pension costs for defined benefit plans 1,088 1,575
Pension costs for defined contribution plans 3,462 3 ,116
Total pension costs 4,550 4,691
1 For each plan, actuarial gains and losses are reported as income or expenses, when the accumulated amount exceeds the so called corridor. The income or
expenses are then recognized over the expected average remaining service period of the employees.
Costs for post-employment benefits other than pensions 2008 2009
Current year service costs 284 270
Interest costs 336 334
Expected return on plan assets (3) (1)
Actuarial gains and losses11 4
Past service costs
– Unvested (1) 7
– Vested 1 0
Curtailments and settlements 01,124
whereof effect of agreement with UAW in Mack Trucks –1,194
Termination benefits 020
Total costs for post-employment benefits other than pensions 618 1,758
1 For each plan, actuarial gains and losses are reported as income or expenses, when the accumulated amount exceed the so called corridor. The income or
expenses are then recognized over the expected average remaining service period of the employees.
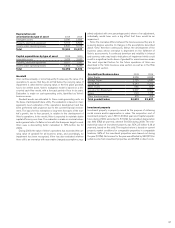
An increase of one percentage point per year in healthcare costs
would change the accumulated post-employment benefit obligation
as of December 31, 2009 by approximately 169, and the post-employ-
ment benefit expense by approximately 12. A decrease of one per-
centage point would decrease the accumulated value of obligations
by about 144 and reduce costs by approximately 10. Calculations
made as of December 31, 2009 show an annual increase of 9% in the
weighted average per capita costs of covered health care benefits; It
is assumed that the percentage will decline gradually to 5% and then
remain at that level.
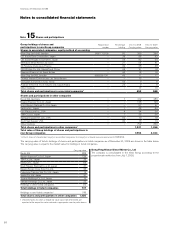
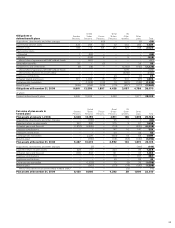
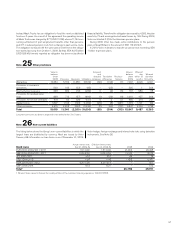
Obligations in
defined benefit plans Sweden
Pensions
United
States
Pensions France
Pensions
Great
Britain
Pensions
US
Other
benefits Other
plans Total
Obligations at January 1, 2008 8,451 11,207 1,800 4,608 5,582 4,336 35,984
Acquisitions, divestments and other changes (13) (226) (2) 116 –22 (103)
Current year service costs 265 224 55 72 269 263 1,148
Interest costs 383 672 93 250 327 168 1,893
Past service costs
– Unvested 1 – – – – – 1
– Vested 627 – – – 6 39
Termination benefits 14 ––––721
Curtailments and settlements (34) 65 (2) –(42) (11) (24)
Employee contributions –––29 –(2) 27
Actuarial (gains) and losses 336 257 47 (304) 261 205 802
Exchange rate translation –2,212 281 (593) 1,151 891 3,942
Benefits paid (312) (790) (185) (143) (577) (552) (2,559)
Obligations at December 31, 2008 9,097 13,648 2,087 4,035 6,971 5,333 41,171
of which
Funded defined benefit plans 8,675 13,322 – 4,035 3,224 2,179 31,435
FINANCIAL INFORMATION 2009
94