Volvo 2009 Annual Report Download - page 85
Download and view the complete annual report
Please find page 85 of the 2009 Volvo annual report below. You can navigate through the pages in the report by either clicking on the pages listed below, or by using the keyword search tool below to find specific information within the annual report.-
 1
1 -
2
-
3
-
4
-
5
-
6
-
7
-
8
-
9
-
10
-
11
-
12
-
13
-
14
-
15
-
16
-
17
-
18
-
19
-
20
-
21
-
22
-
23
-
24
-
25
-
26
-
27
-
28
-
29
-
30
-
31
-
32
-
33
-
34
-
35
-
36
-
37
-
38
-
39
-
40
-
41
-
42
-
43
-
44
-
45
-
46
-
47
-
48
-
49
-
50
-
51
-
52
-
53
-
54
-
55
-
56
-
57
-
58
-
59
-
60
-
61
-
62
-
63
-
64
-
65
-
66
-
67
-
68
-
69
-
70
-
71
-
72
-
73
-
74
-
 75
75 -
 76
76 -
 77
77 -
 78
78 -
 79
79 -
 80
80 -
 81
81 -
 82
82 -
 83
83 -
 84
84 -
 85
85 -
 86
86 -
 87
87 -
 88
88 -
 89
89 -
 90
90 -
 91
91 -
 92
92 -
 93
93 -
 94
94 -
 95
95 -
96
-
97
-
98
-
99
-
100
-
101
-
102
-
103
-
104
-
105
-
106
-
107
-
108
-
109
-
110
-
111
-
112
-
113
-
114
-
115
-
116
-
117
-
118
-
119
-
120
-
121
-
122
-
123
-
124
-
125
-
126
-
127
-
128
-
129
-
130
-
131
-
132
-
133
-
134
-
135
-
136
-
137
-
138
-
139
-
140
-
141
-
142
-
143
-
144
-
145
-
146
 |
 |

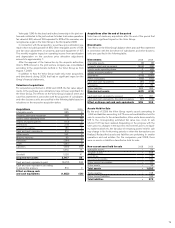
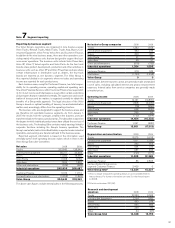
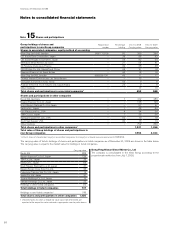
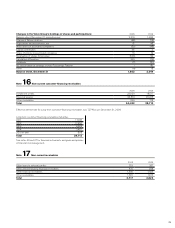
Note 7 Segment reporting
Reporting by business segment
The Volvo Group’s operations are organized in nine business areas:
Volvo Trucks, Renault Trucks, Mack Trucks, Trucks Asia, Buses, Con-
struction Equipment, Volvo Penta, Volvo Aero and Customer Finance.
In addition to the nine business areas, there are other operations con-
sisting mainly of business units that are designed to support the busi-
ness areas’ operations. The business units include Volvo Powertrain,
Volvo 3P, Volvo IT, Volvo Logistics and Volvo Parts. As the four truck
brands share product development, production and other activities in
business units such as Volvo 3P and Volvo Powertrain and also share
certain infrastructure in distribution such as dealers, the four truck
brands are reported as one business segment. The Volvo Group is
thus reported divided in six segments where net sales and operating
income are reported for each product area.
Each business area, except for Customer Finance, has total respon-
sibility for its operating income, operating capital and operating cash
flow. Volvo Financial Services within Customer Finance has responsibil-
ity for its net income and total balance sheet within certain restrictions
and principles that are established centrally. The supervision and coord-
ination of treasury and tax matters is organized centrally to obtain the
benefits of a Group-wide approach. The legal structure of the Volvo
Group is based on optimal handling of treasury, tax and administrative
matters and, accordingly, differs from the operating structure.
The business units are designated to support the business areas and
are therefore not reportable business segments. As from January 1,
2007, the results from the synergies created in the business units are
transferred back to the various product areas. The allocation is based on
the degree to which individual product areas have utilized the services of
the business units. The heading Other contains mainly earnings linked to
corporate functions including the Group’s treasury operations. The
Group’s real estate, held in Volvo Real Estate, is reported under industrial
operations, and earnings are transferred back to the business areas.
Reported segment information is based on the information used
internally by the chief operating decision maker, which in Volvo is the
Volvo Group Executive Committee.
Net sales 2008 2009
Trucks 203,642 138,940
Construction Equipment 56,277 35,658
Buses 17,350 18,465
Volvo Penta 11, 518 8,159
Volvo Aero 7,625 7,803
Other and eliminations (576) (538)
Industrial operations 295,836 208,487
Customer Finance 11, 073 11,712
Reclassifications and eliminations (2,268) (1,838)
Volvo Group 304,642 218,361
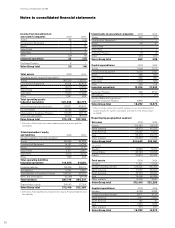
The above sales figures include internal sales in the following amounts:
Net sales to Group companies 2008 2009
Trucks 1,382 1,558
Construction Equipment 483 234
Buses 409 461
Volvo Penta 21 87
Volvo Aero 35 37
Other and eliminations (976) (782)
Industrial operations 1,354 1,595
Customer Finance 376 243
Eliminations (1,730) (1,838)
Volvo Group 0 0
Internal sales between business areas are generally made at standard
cost of sales, including calculated interest and product improvement
expenses. Internal sales from service companies are generally made
at market prices.
Operating income 2008 2009
Trucks 12,167 (10,805)
Construction Equipment 1,808 (4,005)
Buses (76) (350)
Volvo Penta 928 (230)
Volvo Aero 359 50
Other (732) (994)
Industrial operations 14,454 (16,333)
Customer Finance 1,397 (680)
Volvo Group 15,851 (17,013)
Depreciation and amortization 2008 2009
Trucks 8,575 9,618
Construction Equipment 1,927 2,036
Buses 393 555
Volvo Penta 454 515
Volvo Aero 387 435
Other (707) (777)
Industrial operations 11,029 12,382
Customer Finance186 2,845
Reclassification Group versus
segment Customer Finance 2,409 0
Volvo Group total213,524 15,227
1 Volvo no longer reclassifies operating leases on a consolidated level to
finance leases. For further information see note 3 in the Annual report
for 2008.
2 Of which write-down 221 (57).
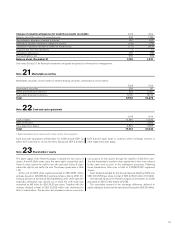
Research and development
expenses 2008 2009
Trucks 10,253 9,525
Construction Equipment 2,134 1,982
Buses 953 918
Volvo Penta 695 665
Volvo Aero 269 170
Other 44 (67)
Volvo Group total 14,348 13,193
81