Volvo 2009 Annual Report Download - page 54
Download and view the complete annual report
Please find page 54 of the 2009 Volvo annual report below. You can navigate through the pages in the report by either clicking on the pages listed below, or by using the keyword search tool below to find specific information within the annual report.-
 1
1 -
2
-
3
-
4
-
5
-
6
-
7
-
8
-
9
-
10
-
11
-
12
-
13
-
14
-
15
-
16
-
17
-
18
-
19
-
20
-
21
-
22
-
23
-
24
-
25
-
26
-
27
-
28
-
29
-
30
-
31
-
32
-
33
-
34
-
35
-
36
-
37
-
38
-
39
-
40
-
41
-
42
-
43
-
 44
44 -
 45
45 -
 46
46 -
 47
47 -
 48
48 -
 49
49 -
 50
50 -
 51
51 -
 52
52 -
 53
53 -
 54
54 -
 55
55 -
 56
56 -
 57
57 -
 58
58 -
 59
59 -
 60
60 -
 61
61 -
 62
62 -
 63
63 -
 64
64 -
65
-
66
-
67
-
68
-
69
-
70
-
71
-
72
-
73
-
74
-
75
-
76
-
77
-
78
-
79
-
80
-
81
-
82
-
83
-
84
-
85
-
86
-
87
-
88
-
89
-
90
-
91
-
92
-
93
-
94
-
95
-
96
-
97
-
98
-
99
-
100
-
101
-
102
-
103
-
104
-
105
-
106
-
107
-
108
-
109
-
110
-
111
-
112
-
113
-
114
-
115
-
116
-
117
-
118
-
119
-
120
-
121
-
122
-
123
-
124
-
125
-
126
-
127
-
128
-
129
-
130
-
131
-
132
-
133
-
134
-
135
-
136
-
137
-
138
-
139
-
140
-
141
-
142
-
143
-
144
-
145
-
146
 |
 |
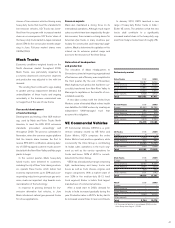
SEGMENTS 2009
The services offered by its nance operations provide many benets to the Volvo Group,
including strengthening brand recognition, simplifying the product acquisition experience,
enhancing customer loyalty and providing value-added services to customers and dealers.
Financial Services
– adaptations from the downturn
uring the downturn, the activ-
ities of customer nance
have proven critical as Volvo
Financial Services (VFS)
worked even more closely
with buyers of Volvo Group
products to help them through these very dif-
cult times.
Risk mitigation and risk management
The severely depressed global economy con-
tinued to negatively affect the cash flow and
business models of VFS’ customers, compro-
mising VFS’ ability to generate prots in 2009.
However, toward the end of the year there
were signs of improvement in certain areas
The overriding focus throughout the organ-
ization centered on downturn management.
Initiatives were geared toward customer
account and asset management, as VFS
strengthened its collection activities. Accord-
ingly, inventory management and asset remar-
keting took on increased importance.
Rationalization of the cost structure
As the global economies emerge from this
downturn, VFS intends to use the lessons
learned to adapt the business models in order
to secure sustainable protability and strong
returns over future business cycles.
Implementing these changes begins by
identifying those segments and markets which
have not met prot expectations over the cur-
rent business cycle. At the same time, a plan is
developed for achieving even higher penetra-
tion levels in those segments and markets
which have demonstrated acceptable perform-
ance levels throughout the downturn. Priori-
ties and resources are shifted accordingly.
Rationalization of the cost structure is a key
component of the operating strategy, along
with a focus on right sizing the business in
response to current market conditions. Other
initiatives include exploiting organizational and
operational economies of scale, while making
sure that VFS has adequate resources to con-
tinue to handle loss mitigation and recovery
activities.
D
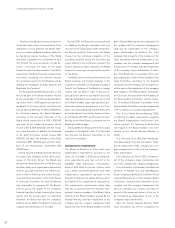
5% (3)
Net sales as percentage of
Volvo Group sales
1) Years starting 2006 are reported according to a new report-
ing structure, in which Volvo Group Real Estate and Volvo
Treasury are not included in VFS. See note 7.
2) Share of business nanced by Financial Services in
markets where nancial services are offered.
Conducts operations in customer and dealer
nancing.
Number of employees
1,234
Position on world market
Volvo Financial Services operates exclusively
to support the sales and leasing of vehicles
and machines which are produced by the other
Business Areas, enhancing their competitiveness.
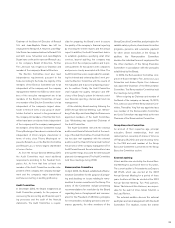
0908070605
(680) SEK M 1,3971,6491,6862,033
Operating income1
29
Volvo
Trucks Renault
Trucks Mack
Trucks Buses Volvo
CE
30 18 20 1614 14 16 36 34
09
08
%
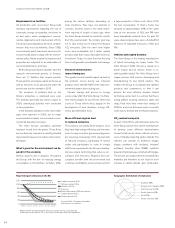
Penetration by business area2
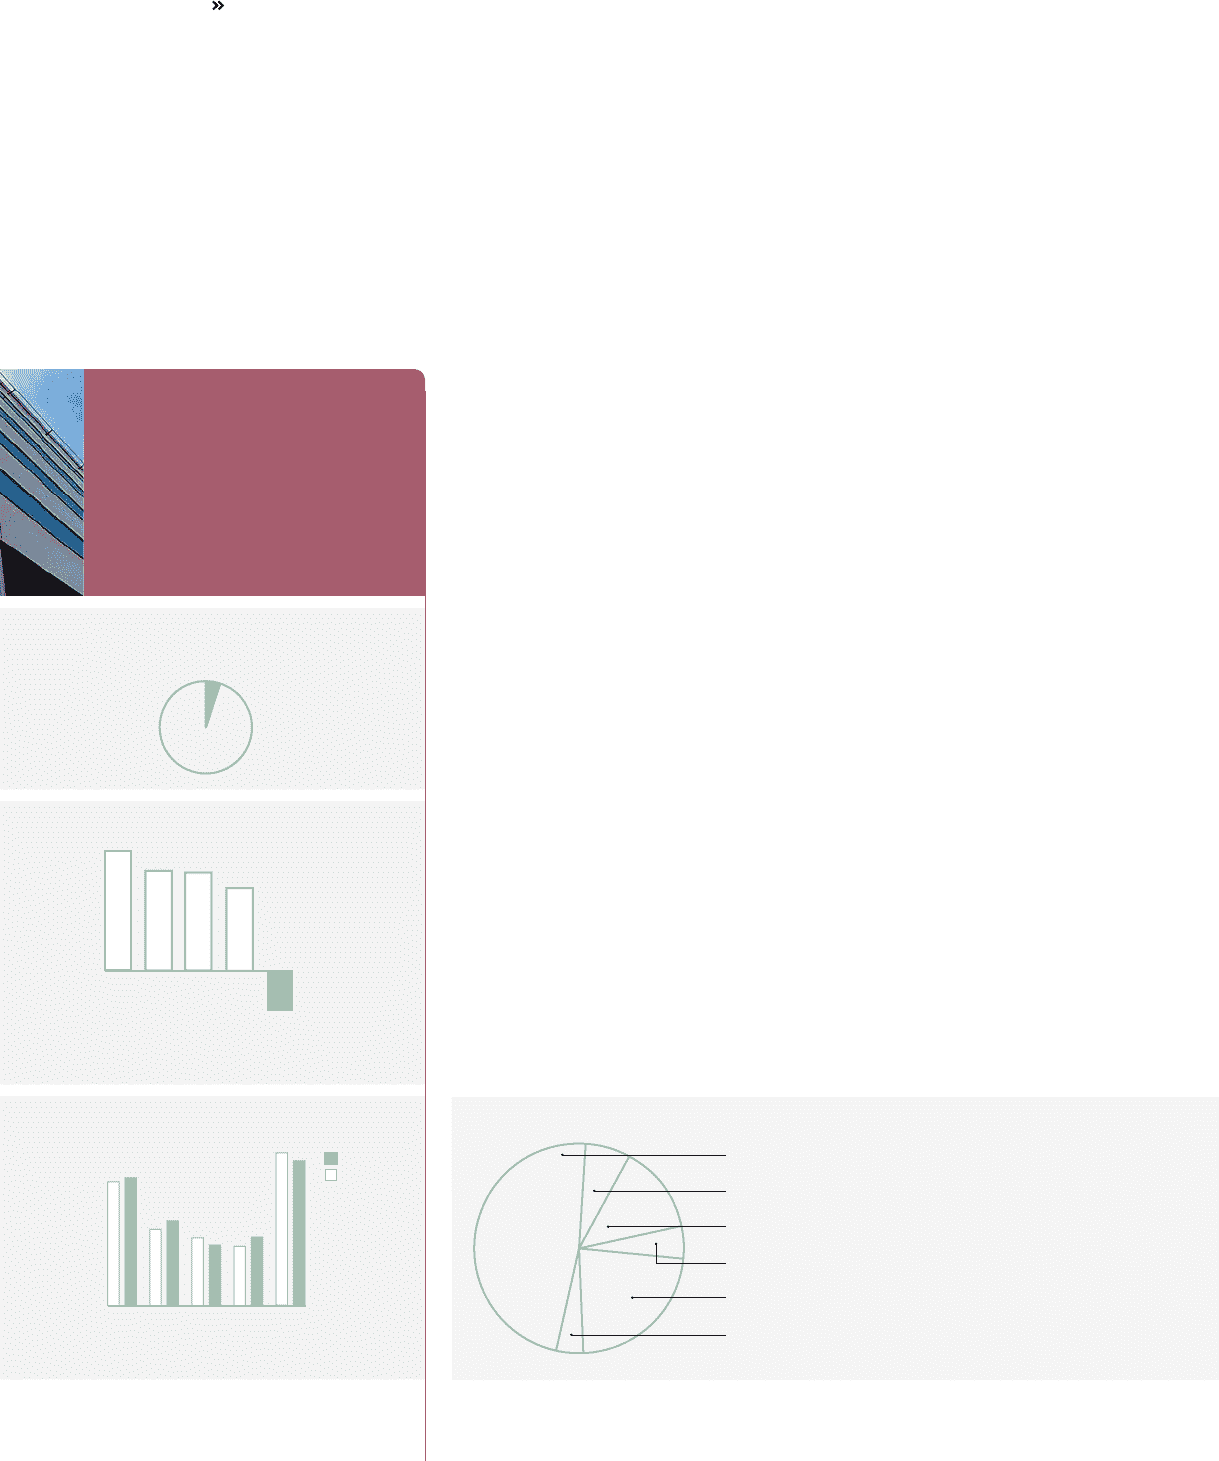
Volvo Trucks 48%
Mack Trucks 7%
Renault Trucks 14%
Buses 5%
Volvo CE 23%
Other 4%
Credit portfolio by business area
50