Volvo 2009 Annual Report Download - page 47
Download and view the complete annual report
Please find page 47 of the 2009 Volvo annual report below. You can navigate through the pages in the report by either clicking on the pages listed below, or by using the keyword search tool below to find specific information within the annual report.-
 1
1 -
2
-
3
-
4
-
5
-
6
-
7
-
8
-
9
-
10
-
11
-
12
-
13
-
14
-
15
-
16
-
17
-
18
-
19
-
20
-
21
-
22
-
23
-
24
-
25
-
26
-
27
-
28
-
29
-
30
-
31
-
32
-
33
-
34
-
35
-
36
-
 37
37 -
 38
38 -
 39
39 -
 40
40 -
 41
41 -
 42
42 -
 43
43 -
 44
44 -
 45
45 -
 46
46 -
 47
47 -
 48
48 -
 49
49 -
 50
50 -
 51
51 -
 52
52 -
 53
53 -
 54
54 -
 55
55 -
 56
56 -
 57
57 -
58
-
59
-
60
-
61
-
62
-
63
-
64
-
65
-
66
-
67
-
68
-
69
-
70
-
71
-
72
-
73
-
74
-
75
-
76
-
77
-
78
-
79
-
80
-
81
-
82
-
83
-
84
-
85
-
86
-
87
-
88
-
89
-
90
-
91
-
92
-
93
-
94
-
95
-
96
-
97
-
98
-
99
-
100
-
101
-
102
-
103
-
104
-
105
-
106
-
107
-
108
-
109
-
110
-
111
-
112
-
113
-
114
-
115
-
116
-
117
-
118
-
119
-
120
-
121
-
122
-
123
-
124
-
125
-
126
-
127
-
128
-
129
-
130
-
131
-
132
-
133
-
134
-
135
-
136
-
137
-
138
-
139
-
140
-
141
-
142
-
143
-
144
-
145
-
146
 |
 |

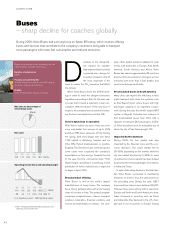
Net sales by market
Buses, SEK M 2008 2009
Europe 7,338 7,707
North America 5,367 5,673
South America 1,575 1,235
Asia 2,099 2,749
Other markets 971 1,101
Total 17,350 18,465
Deliveries by market
Buses 2008 2009
Europe 3,313 3,164
North America 1,884 1,539
South America 995 690
Asia 3,033 3,839
Other markets 712 625
Total 9,937 9,857
the year, Volvo Buses managed to strengthen
its market shares in the business regions of
North America, South America and Asia.
Increased sales
In 2009, net sales increased to SEK 18,465 M
(17,350). The operating loss increased from
SEK 76 M to SEK 350 M. The operating margin
amounted to a negative 1.9% (Negative 0.4%).
One factor behind the increased loss is the
shift in sales to Asia where the price pressure
is higher and margins are lower. Another factor
is an unfavorable currency development. The
global protability program aimed at reducing
costs continued with undiminished force.
New city bus factory in the U.S.
During the year, Volvo Buses’ subsidiary Nova
Bus inaugurated a new plant in Plattsburgh,
New York, U.S. Production in the U.S. is a
requirement in order to be able to sell city
buses in the country. Nova Bus received a rst
order from New York City for 90 articulated
buses.
Outcome 2009
Many activities contributed to a signicantly improved •
cash flow.
Euro V engines were introduced with lower fuel •
consumption and lower emissions.
Successful eld test with hybrid buses and in phase for •
the start of serial production in the spring of 2010.
Increased sales of telematics. Increased focus on •
nancial solutions for customers.
Volvo 9700 launched in North America and new city •
bus factory in the U.S.
Product and warranty costs have been lowered.•
Ambitions 2010
Protable growth in all regions. •
Continued focus on cost-cutting and lower •
inventory levels.
Increased sales of services and aftermarket •
products.
Secure successful introductions of Euro V, •
EPA 2010 and hybrids.
Ambitions 2009
Strong focus on cash flow. •
Secure a successful introduction of buses with •
Euro V engines and hybrid buses.
Increased efforts in developing service and •
aftermarket products.
Continued work with protability program focused •
on selective expansion and reduced costs.
43