Volvo 2009 Annual Report Download - page 4
Download and view the complete annual report
Please find page 4 of the 2009 Volvo annual report below. You can navigate through the pages in the report by either clicking on the pages listed below, or by using the keyword search tool below to find specific information within the annual report.-
 1
1 -
 2
2 -
 3
3 -
 4
4 -
 5
5 -
 6
6 -
 7
7 -
 8
8 -
 9
9 -
 10
10 -
 11
11 -
 12
12 -
 13
13 -
 14
14 -
 15
15 -
16
-
17
-
18
-
19
-
20
-
21
-
22
-
23
-
24
-
25
-
26
-
27
-
28
-
29
-
30
-
31
-
32
-
33
-
34
-
35
-
36
-
37
-
38
-
39
-
40
-
41
-
42
-
43
-
44
-
45
-
46
-
47
-
48
-
49
-
50
-
51
-
52
-
53
-
54
-
55
-
56
-
57
-
58
-
59
-
60
-
61
-
62
-
63
-
64
-
65
-
66
-
67
-
68
-
69
-
70
-
71
-
72
-
73
-
74
-
75
-
76
-
77
-
78
-
79
-
80
-
81
-
82
-
83
-
84
-
85
-
86
-
87
-
88
-
89
-
90
-
91
-
92
-
93
-
94
-
95
-
96
-
97
-
98
-
99
-
100
-
101
-
102
-
103
-
104
-
105
-
106
-
107
-
108
-
109
-
110
-
111
-
112
-
113
-
114
-
115
-
116
-
117
-
118
-
119
-
120
-
121
-
122
-
123
-
124
-
125
-
126
-
127
-
128
-
129
-
130
-
131
-
132
-
133
-
134
-
135
-
136
-
137
-
138
-
139
-
140
-
141
-
142
-
143
-
144
-
145
-
146
 |
 |

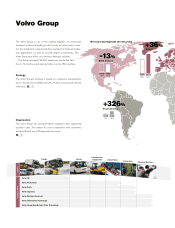
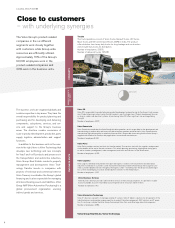
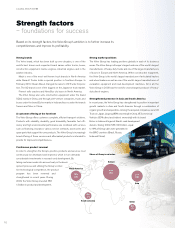
Customers
Volvo Group customers are active in about 180 countries worldwide.
Group sales of products and services are conducted through both
wholly owned and independent dealers. The global service network
handles customer demand for spare parts and other services.
&
14
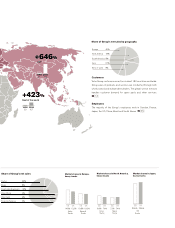
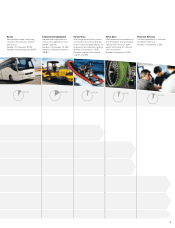
Employees
The majority of the Group’s employees work in Sweden, France,
Japan, the US, China, Brazil and South Korea. &
55
45%
18%
8%
21%
8%
Europe
North America
South America
Asia
Rest of world
Share of Group’s net sales by geography
Trucks 63%
Buses 8%
Construction Equipment 16%
Volvo Penta 4%
Volvo Aero 4%
Financial Services 5%
Share of Group’s net sales
09080908
7.4%7.3%7.4%8.9%
Mack
Trucks
Volvo
Trucks
23.5%22.6%
UD
Trucks
0908
09080908
10.6%10.8%13.2%14.8%
Volvo
Trucks Renault
Trucks
Market shares in Europe,
heavy trucks
Market shares in North America,
heavy trucks
Market shares in Japan,
heavy trucks
Asia
Rest of the world
+646%
+423%
2009
1999
44.86.0
2009
1999
15.73.0