Volvo 2009 Annual Report Download - page 118
Download and view the complete annual report
Please find page 118 of the 2009 Volvo annual report below. You can navigate through the pages in the report by either clicking on the pages listed below, or by using the keyword search tool below to find specific information within the annual report.
Parent Company AB Volvo
Corporate registration number 556012-5790.
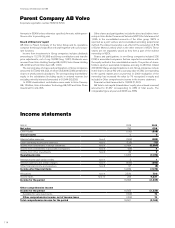
Income statements
Amounts in SEK M unless otherwise specified. Amounts within paren-
theses refer to preceding year.
Board of Directors’ report
AB Volvo is Parent Company of the Volvo Group and its operations
comprise the Group’s head office with staff together with some corpo-
rate functions.
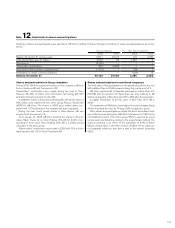
Income from investments in Group companies includes dividends
amounting to 10,275 (15,356) and Group contributions and transfer
price adjustments, net of neg 16,859 (neg 1,521). Dividends were
received from Volvo Holding Sverige AB, 6,000, Volvo Korea Holding
AB, 2,000 and from Volvo Aero AB, 1,000.
The carrying value of shares and participations in Group companies
amounted to 57,062 (46,122), of which 56,536 (45,596) pertained to
shares in wholly owned subsidiaries. The corresponding shareholders’
equity in the subsidiaries (including equity in untaxed reserves but
excluding minority interests) amounted to 91,944 (92,009).
In 2009 shareholders’ contributions were made to Volvo Treasury
AB, 10 billion, Volvo Information Technology AB, 500 and Volvo China
Investment Co Ltd, 355.
Other shares and participations include the direct and indirect own-
ership in Volvo Eicher Commercial Vehicles (VECV) for total amount of
1,845. In the consolidated accounts of the Volvo group, VECV is
reported as a joint venture and consolidated according proportional
method. The indirect ownership is an effect of the acquisition of 8.1%
of Eicher Motors Limited, which is the other venturer of VECV. These
shares are not separately valued as they form a part of the indirect
ownership in VECV.
Shares and participations in non-Group companies included 206
(199) in associated companies that are reported in accordance with
the equity method in the consolidated accounts. The portion of share-
holders’ equity in associated companies accruing to AB Volvo totaled
300 (303). Shares and participations in non-Group companies include
listed shares in Deutz AG with a carrying value of 286, corresponding
to the quoted market price at year-end. In 2009 revaluation of the
ownership has increased the value by 74, recognized in equity and
included in Other comprehensive income in the income statement.
Financial net debt amounted to 18,922 (11,510).
AB Volvo’s risk capital (shareholders’ equity plus untaxed reserves)
amounted to 31,357 corresponding to 45% of total assets. The
comparable figure at year-end 2008 was 65%.
SEK M 2008 2009
Net sales 790 698
Cost of sales (790) (698)
Gross income 00
Administrative expenses Note 2 (524) (485)
Other operating income and expenses Note 3 (126) (13)
Income from investments in Group companies Note 4 15,494 (6,584)
Income from investments in associated companies Note 5 (59) 4
Income from other investments Note 6 30 2
Operating income 14,815 (7,076)
Interest income and similar credits Note 7 21
Interest expenses and similar charges Note 7 (845) (393)
Other financial income and expenses Note 8 97 (8)
Income after financial items 14,069 (7,476)
Allocations Note 9 2,530 700
Income taxes Note 10 226 4,537
Income for the period 16,825 (2,239)
Other comprehensive income
Income for the period 16,825 (2,239)
Available-for-sale investments (324) 74
Other comprehensive income, net of income taxes (324) 74
Total comprehensive income for the period 16,501 (2,165)
FINANCIAL INFORMATION 2009
114


