Volvo 2009 Annual Report Download - page 115
Download and view the complete annual report
Please find page 115 of the 2009 Volvo annual report below. You can navigate through the pages in the report by either clicking on the pages listed below, or by using the keyword search tool below to find specific information within the annual report.-
 1
1 -
2
-
3
-
4
-
5
-
6
-
7
-
8
-
9
-
10
-
11
-
12
-
13
-
14
-
15
-
16
-
17
-
18
-
19
-
20
-
21
-
22
-
23
-
24
-
25
-
26
-
27
-
28
-
29
-
30
-
31
-
32
-
33
-
34
-
35
-
36
-
37
-
38
-
39
-
40
-
41
-
42
-
43
-
44
-
45
-
46
-
47
-
48
-
49
-
50
-
51
-
52
-
53
-
54
-
55
-
56
-
57
-
58
-
59
-
60
-
61
-
62
-
63
-
64
-
65
-
66
-
67
-
68
-
69
-
70
-
71
-
72
-
73
-
74
-
75
-
76
-
77
-
78
-
79
-
80
-
81
-
82
-
83
-
84
-
85
-
86
-
87
-
88
-
89
-
90
-
91
-
92
-
93
-
94
-
95
-
96
-
97
-
98
-
99
-
100
-
101
-
102
-
103
-
104
-
 105
105 -
 106
106 -
 107
107 -
 108
108 -
 109
109 -
 110
110 -
 111
111 -
 112
112 -
 113
113 -
 114
114 -
 115
115 -
 116
116 -
 117
117 -
 118
118 -
 119
119 -
 120
120 -
 121
121 -
 122
122 -
 123
123 -
 124
124 -
 125
125 -
126
-
127
-
128
-
129
-
130
-
131
-
132
-
133
-
134
-
135
-
136
-
137
-
138
-
139
-
140
-
141
-
142
-
143
-
144
-
145
-
146
 |
 |
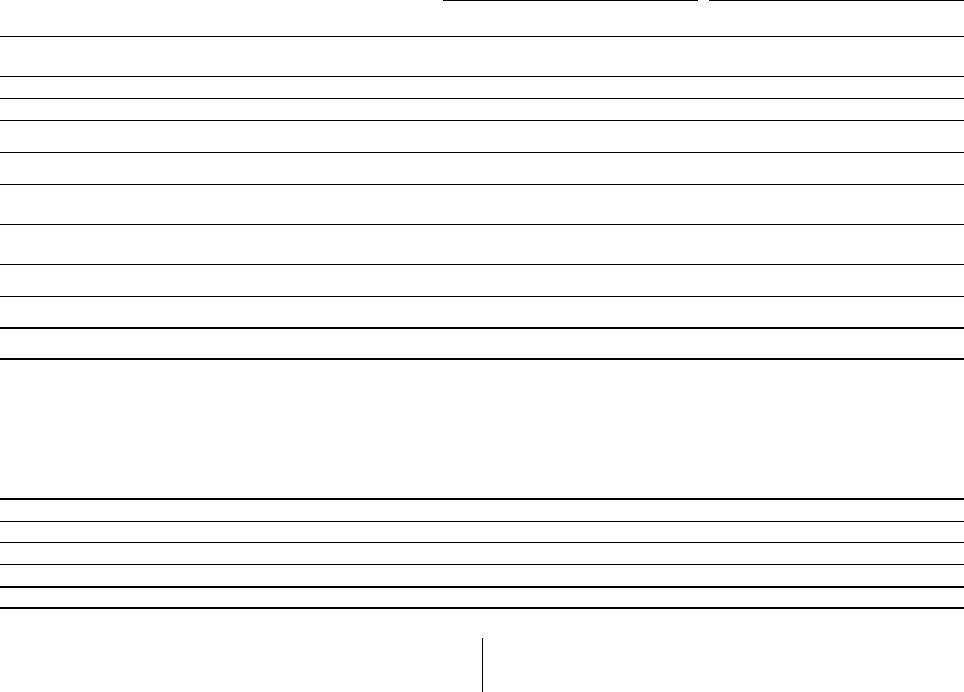
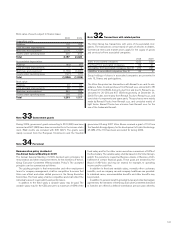
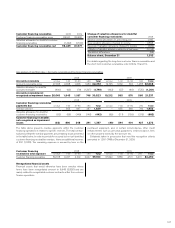
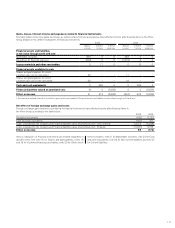
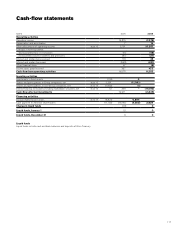
Gains, losses, interest income and expenses related to financial instruments
The table below shows how gains and losses as well as interest income and expense have affected income after financial items in the Volvo
Group divided on the different categories of financial instruments.
2008 2009
Gains/
Losses Interest
income Interest
expenses Gains/
Losses Interest
income Interest
expenses
Financial assets and liabilities
at fair value through profit and loss1
Marketable securities 864 0 0 248 0 0
Derivatives for financial exposure (924) 0 0 (1,272) 0 0
Loans receivable and other receivables 011 0 0 10 0
Financial assets available for sale
Shares and participations for which
a market value can be calculated 42 – – 11 – –
Shares and participations for which
a market value can not be calculated 60 – – 19 – –
Cash and cash equivalents 0362 0 0 299 0
Financial liabilities valued at amortized cost (1) 0(5,083) 0 0 (5,259)
Effect on income 41 373 (5,083) (994) 309 (5,259)
1 Accrued and realized interest is included in gains and losses related to Financial assets and liabilities at fair value through profit and loss.
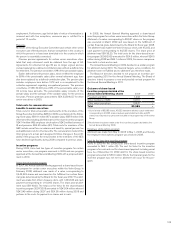
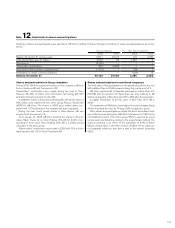
Net effect of foreign exchange gains and losses
Foreign exchange gains and losses pertaining to financial instruments have affected income after financial items in
the Volvo Group according to the table below:
2008 2009
Derivative instruments (812) (1,131)
Cash and cash equivalents (421) 471
Loans originated by the company and Financial liabilities value at amortized cost – Volvo internal 12,373 (5,268)
Loans originated by the company and Financial liabilities value at amortized cost – External (11, 041) 5,755
Effect on income 99 (173)
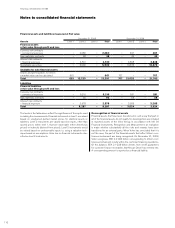
Various categories of financial instruments are treated separately in
specific notes. See note 15 for Shares and participations, notes 16
and 19 for Customer-financing receivables, note 20 for Other short-
term receivables, note 21 for Marketable securities, note 22 for Cash
and cash equivalents, note 26 for Non-current liabilities and note 27
for Current liabilities.
111