Volvo 2009 Annual Report Download - page 72
Download and view the complete annual report
Please find page 72 of the 2009 Volvo annual report below. You can navigate through the pages in the report by either clicking on the pages listed below, or by using the keyword search tool below to find specific information within the annual report.-
 1
1 -
2
-
3
-
4
-
5
-
6
-
7
-
8
-
9
-
10
-
11
-
12
-
13
-
14
-
15
-
16
-
17
-
18
-
19
-
20
-
21
-
22
-
23
-
24
-
25
-
26
-
27
-
28
-
29
-
30
-
31
-
32
-
33
-
34
-
35
-
36
-
37
-
38
-
39
-
40
-
41
-
42
-
43
-
44
-
45
-
46
-
47
-
48
-
49
-
50
-
51
-
52
-
53
-
54
-
55
-
56
-
57
-
58
-
59
-
60
-
61
-
 62
62 -
 63
63 -
 64
64 -
 65
65 -
 66
66 -
 67
67 -
 68
68 -
 69
69 -
 70
70 -
 71
71 -
 72
72 -
 73
73 -
 74
74 -
 75
75 -
 76
76 -
 77
77 -
 78
78 -
 79
79 -
 80
80 -
 81
81 -
 82
82 -
83
-
84
-
85
-
86
-
87
-
88
-
89
-
90
-
91
-
92
-
93
-
94
-
95
-
96
-
97
-
98
-
99
-
100
-
101
-
102
-
103
-
104
-
105
-
106
-
107
-
108
-
109
-
110
-
111
-
112
-
113
-
114
-
115
-
116
-
117
-
118
-
119
-
120
-
121
-
122
-
123
-
124
-
125
-
126
-
127
-
128
-
129
-
130
-
131
-
132
-
133
-
134
-
135
-
136
-
137
-
138
-
139
-
140
-
141
-
142
-
143
-
144
-
145
-
146
 |
 |

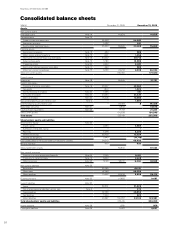
Consolidated balance sheets
SEK M December 31, 2008 December 31, 2009
Assets
Non-current assets
Intangible assets Note 14 43,958 41,628
Tangible assets Note 14
Property, plant and equipment 56,248 54,289
Investment property 1,022 991
Assets under operating leases 25,429 82,699 20,388 75,668
Financial assets
Associated companies Note 15 652 588
Other shares and participations Note 15 1,301 1,456
Non-current customer-financing receivables Note 16 50,432 39,713
Deferred tax assets Note 12 11,18 0 12,595
Prepaid pensions Note 24 2,442 2,049
Non-current interest-bearing receivables Note 17 694 585
Other non-current receivables Note 17 3,023 69,724 3,038 60,024
Total non-current assets 196,381 177,320
Current assets
Inventories Note 18 55,045 37,727
Current receivables
Customer-financing receivables Note 19 48,057 42,264
Tax assets 1,810 1,523
Interest-bearing receivables Note 20 1,965 410
Accounts receivable Note 20 30,523 21,337
Other receivables Note 20 15,024 12,082
Non interest-bearing assets held for sale Note 4 – 1,684
Interest-bearing assets held for sale –97,379 879,308
Marketable securities Note 21 5,902 16,676
Cash and cash equivalents Note 22 17,712 21,234
Total current assets 176,038 154,945
Total assets 372,419 332,265
Shareholders’ equity and liabilities
Shareholders’ equity Note 23
Share capital 2,554 2,554
Additional contributed capital – –
Reserves 5,078 6,235
Retained earnings 66,436 72,334
Income for the period 9,942 (14,718)
Equity attributable to the equity holders of the parent company 84,010 66,405
Minority interests 630 629
Total shareholders’ equity 84,640 67,034
Non-current provisions
Provisions for post-employment benefits Note 24 11,70 5 8,051
Provisions for deferred taxes Note 12 8,260 3,638
Other provisions Note 25 8,136 28,101 6,360 18,049
Non-current liabilities Note 26
Bond loans 35,798 49,191
Other loans 47,298 56,035
Other liabilities 10,442 93,538 9,888 115,114
Current provisions Note 25 10,883 9,487
Current liabilities Note 27
Loans 62,631 51,626
Non interest-bearing liabilities held for sale Note 4 – 272
Trade payables 51,025 35,955
Tax liabilities 1,204 623
Other liabilities 40,397 155.257 34,105 122,581
Total shareholders’ equity and liabilities 372,419 332,265
Assets pledged Note 28 1,380 958
Contingent liabilities Note 29 9,427 9,607
FINANCIAL INFORMATION 2009
68