Volvo 2009 Annual Report Download - page 28
Download and view the complete annual report
Please find page 28 of the 2009 Volvo annual report below. You can navigate through the pages in the report by either clicking on the pages listed below, or by using the keyword search tool below to find specific information within the annual report.-
 1
1 -
2
-
3
-
4
-
5
-
6
-
7
-
8
-
9
-
10
-
11
-
12
-
13
-
14
-
15
-
16
-
17
-
 18
18 -
 19
19 -
 20
20 -
 21
21 -
 22
22 -
 23
23 -
 24
24 -
 25
25 -
 26
26 -
 27
27 -
 28
28 -
 29
29 -
 30
30 -
 31
31 -
 32
32 -
 33
33 -
 34
34 -
 35
35 -
 36
36 -
 37
37 -
 38
38 -
39
-
40
-
41
-
42
-
43
-
44
-
45
-
46
-
47
-
48
-
49
-
50
-
51
-
52
-
53
-
54
-
55
-
56
-
57
-
58
-
59
-
60
-
61
-
62
-
63
-
64
-
65
-
66
-
67
-
68
-
69
-
70
-
71
-
72
-
73
-
74
-
75
-
76
-
77
-
78
-
79
-
80
-
81
-
82
-
83
-
84
-
85
-
86
-
87
-
88
-
89
-
90
-
91
-
92
-
93
-
94
-
95
-
96
-
97
-
98
-
99
-
100
-
101
-
102
-
103
-
104
-
105
-
106
-
107
-
108
-
109
-
110
-
111
-
112
-
113
-
114
-
115
-
116
-
117
-
118
-
119
-
120
-
121
-
122
-
123
-
124
-
125
-
126
-
127
-
128
-
129
-
130
-
131
-
132
-
133
-
134
-
135
-
136
-
137
-
138
-
139
-
140
-
141
-
142
-
143
-
144
-
145
-
146
 |
 |
BOARD OF DIRECTORS’ REPORT 2009
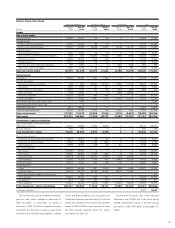
Income Statement Volvo Group
SEK M 2008 2009
Net sales Volvo Group 304,642 218,361
Operating Income Volvo Group 15,851 (17,013)
Operating income Industrial operations 14,454 (16,333)
Operating income Customer Finance 1,397 (680)
Interest income and similar credits 1,171 390
Interest expense and similar credits (1,935) (3,559)
Other nancial income and costs (1,077) (392)
Income after financial items 14,010 (20,573)
Income taxes (3,994) 5,889
Income for the period 10,016 (14,685)
Income Statement Industrial operations
SEK M 2008 2009
Net sales 295,836 208,487
Cost of sales (233,514) (179,578)
Gross income 62,322 28,909
Gross margin, % 21.1 13.9
Research and development expenses (14,348) (13,193)
Selling expenses (25,597) (23,752)
Administrative expenses (6,921) (5,838)
Other operating income and expenses (1,094) (2,432)
Income from investments in associated companies 23 (15)
Income from other investments 69 (13)
Operating income Industrial operations 14,454 (16,333)
Operating margin, % 4.9 (7.8)
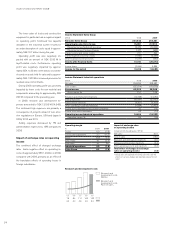
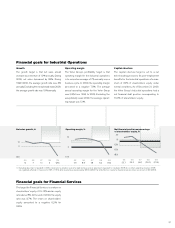
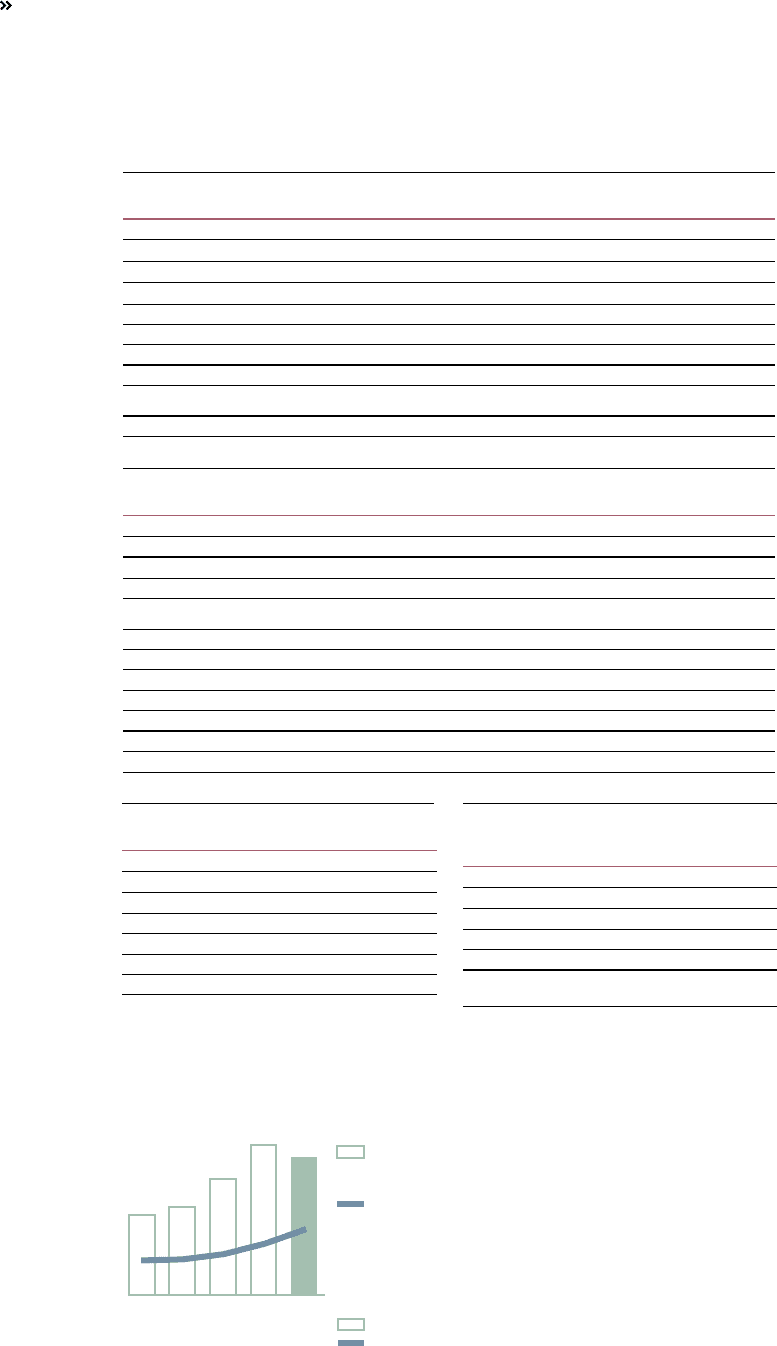
0908070605
13.214.311.18.47.6
6.34.93.93.43.3
Research and
development costs,
SEK bn
Research and
development costs,
% of net sales
Operating margin
%2008 2009
Trucks 6.0 (7.8)
Construction Equipment 3.2 (11. 2)
Buses (0.4) (1.9)
Volvo Penta 8.1 (2.8)
Volvo Aero 4.7 0.6
Industrial operations 4.9 (7.8)
Volvo Group 5.2 (7.8)
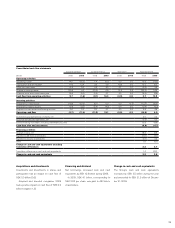
Impact of exchange rates
on operating income
Compared with preceding year, SEK bn
Net sales120.9
Cost of sales (19.5)
Research and development expenses (0.5)
Selling and administrative expenses (2.4)
Other operating income and expenses (0.4)
Total effect of changes in exchange
rates on operating income (1.9)
1 Group sales are reported at monthly spot rates and the
effects of currency hedges are reported among “Cost of
sales”.
The lower sales of trucks and construction
equipment in particular had a negative impact
on operating prot. Continued low capacity
utilization in the industrial system resulted in
an under absorption of costs equal to approxi-
mately SEK 10.7 billion during the year.
Operating prot was also negatively im-
pacted with an amount of SEK 2,150 M in
layoff-related costs. Furthermore, operating
prot was negatively impacted by approxi-
mately SEK 1,120 M in write-downs on invento-
ries and on assets held for sale and by approxi-
mately SEK 1,200 M in increased provisions for
residual value commitments.
During 2009, operating prot was positively
impacted by lower costs for raw material and
components amounting to approximately SEK
200 M compared to the preceding year.
In 2009, research and development ex-
penses amounted to SEK 13,193 M (14,348).
The continued high expenses are primarily a
consequence of projects ahead of new emis-
sion regulations in Europe, USA and Japan in
2009, 2010 and 2011.
Selling expenses decreased by 7% and
administration expenses by 16% compared to
2008.
Impact of exchange rates on operating
income
The combined effect of changed exchange
rates had a negative effect on operating in-
come of approximately SEK 1.9 billion in 2009,
compared with 2008, primarily as an effect of
the translation effects of operating losses in
foreign subsidiaries.
Research and development costs
24