Volvo 2009 Annual Report Download - page 31
Download and view the complete annual report
Please find page 31 of the 2009 Volvo annual report below. You can navigate through the pages in the report by either clicking on the pages listed below, or by using the keyword search tool below to find specific information within the annual report.-
 1
1 -
2
-
3
-
4
-
5
-
6
-
7
-
8
-
9
-
10
-
11
-
12
-
13
-
14
-
15
-
16
-
17
-
18
-
19
-
20
-
 21
21 -
 22
22 -
 23
23 -
 24
24 -
 25
25 -
 26
26 -
 27
27 -
 28
28 -
 29
29 -
 30
30 -
 31
31 -
 32
32 -
 33
33 -
 34
34 -
 35
35 -
 36
36 -
 37
37 -
 38
38 -
 39
39 -
 40
40 -
 41
41 -
42
-
43
-
44
-
45
-
46
-
47
-
48
-
49
-
50
-
51
-
52
-
53
-
54
-
55
-
56
-
57
-
58
-
59
-
60
-
61
-
62
-
63
-
64
-
65
-
66
-
67
-
68
-
69
-
70
-
71
-
72
-
73
-
74
-
75
-
76
-
77
-
78
-
79
-
80
-
81
-
82
-
83
-
84
-
85
-
86
-
87
-
88
-
89
-
90
-
91
-
92
-
93
-
94
-
95
-
96
-
97
-
98
-
99
-
100
-
101
-
102
-
103
-
104
-
105
-
106
-
107
-
108
-
109
-
110
-
111
-
112
-
113
-
114
-
115
-
116
-
117
-
118
-
119
-
120
-
121
-
122
-
123
-
124
-
125
-
126
-
127
-
128
-
129
-
130
-
131
-
132
-
133
-
134
-
135
-
136
-
137
-
138
-
139
-
140
-
141
-
142
-
143
-
144
-
145
-
146
 |
 |

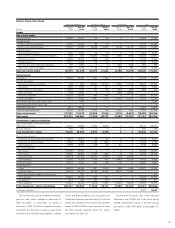
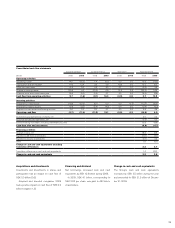
Balance Sheets Volvo Group
Industrial operations Customer Finance Eliminations Total
SEK M Dec 31
2008
Dec 31
2009
Dec 31
2008
Dec 31
2009
Dec 31
2008
Dec 31
2009
Dec 31
2008
Dec 31
2009
Assets
Non-current assets
Intangible assets 43,909 41,532 49 96 0 0 43,958 41,628
Tangible assets
Property, plant and equipment 57,185 55,208 86 72 0 0 57,270 55,280
Assets under operating leases 16,967 13,539 13,238 10,955 (4,776) (4,106) 25,429 20,388
Financial assets
Shares and participation 1,935 2,025 18 19 0 0 1,953 2,044
Non-current customer-nancing receivables 467 531 50,460 39,720 (495) (538) 50,432 39,713
Deferred tax assets 10,976 12,277 204 318 0 0 11,18 0 12,595
Prepaid pensions 2,431 2,038 10 10 0 0 2,442 2,049
Non-current interest-bearing receivables 149 1,095 0 0 545 (510) 694 585
Other non-current receivables 3,051 3,033 28 42 (56) (36) 3,023 3,038
Total non-current assets 137,070 131,278 64,093 51,232 (4,782) (5,190) 196,381 177,320
Current assets
Inventories 54,084 35,765 961 1,962 0 0 55,045 37,727
Current receivables
Customer-nancing receivables 508 836 48,382 42,443 (833) (1,015) 48,057 42,264
Tax assets 1,749 1,362 61 161 0 0 1,810 1,523
Interest-bearing receivables 2,684 1,215 21 66 (740) (872) 1,965 410
Internal funding 792 3,662 0 0 (792) (3,662) – –
Accounts receivable 30,137 20,877 386 460 0 0 30,523 21,337
Other receivables 14,673 11, 4 5 9 1,495 1,701 (1,145) (1,077) 15,024 12,082
Non interest-bearing assets held for sale – 1,684 – – – – – 1,684
Interest-bearing assets held for sale – 8 – – – – – 8
Marketable securities 5,901 16,655 2 21 0 0 5,902 16,676
Cash and cash equivalents 16,674 20,749 2,245 726 (1,207) (241) 17,712 21,234
Total current assets 127,202 114,272 53,553 47,540 (4,717) (6,867) 176,038 154,945
Total assets 264,272 245,550 117,646 98,772 (9,499) (12,057) 372,419 332,265
Shareholders’ equity and liabilities
Equity attributable to the equity holders
of the parent company 74,416 57,856 9,594 8,549 0 0 84,010 66,405
Minority interests 630 629 0 0 0 0 630 629
Total shareholders’ equity 75,046 58,485 9,594 8,549 0 0 84,640 67,034
Non-current provisions
Provisions for post-employment benets 11, 677 8,021 28 30 0 0 11,70 5 8,051
Provisions for deferred taxes 6,557 1,858 1,703 1,780 0 0 8,260 3,638
Other provisions 7,938 6,277 148 80 50 2 8,136 6,360
Non-current liabilities
Bond loans 35,798 49,191 0 0 0 0 35,798 49,191
Other loans 39,880 48,684 7,426 7,458 (7) (107) 47,298 56,035
Internal funding (44,934) (30,908) 45,054 32,758 (119) (1,849) – –
Other liabilities 13,249 11,762 674 479 (3,483) (2,353) 10,442 9,888
Current provisions 10,723 9,321 122 164 38 2 10,883 9,487
Current liabilities
Loans 56,178 44,196 7,241 8,305 (788) (876) 62,631 51,626
Internal funding (40,173) (32,273) 42,784 36,457 (2,610) (4,184) – –
Non interest-bearing liabilities held for sale – 272 – – – – – 272
Trade payables 50,622 35,754 404 201 0 0 51,025 35,955
Tax liabilities 1,044 369 160 254 0 0 1,204 623
Other liabilities 40,667 34,541 2,308 2,257 (2,580) (2,692) 40,397 34,105
Total shareholders’ equity and liabilities 264,272 245,550 117,646 98,772 (9,499) (12,057) 372,419 332,265
Contingent liabilities 9,427 9,607
The net value of assets and liabilities related to
pensions and similar obligations amounted to
SEK 6.0 billion on December 31, 2009, a
decrease of SEK 3.3 billion compared to year-
end 2008. The decrease is mainly a result of the
reclassication of healthcare obligations in Mack
Trucks to a nancial liability as a consequence of
the Master Agreement between Mack Trucks and
United Auto Workers. Post-employment benets
valued at SEK 9.5 billion were reported outside
the Volvo Group’s balance sheet. For further
information see Note 24.
At year-end, the equity ratio in the Industrial
Operations was 23.8% and in the Volvo Group
20.2%. Shareholder’s equity in the Volvo Group
amounted to SEK 67.0 billion at December 31,
2009.
27