Volvo 2009 Annual Report Download - page 27
Download and view the complete annual report
Please find page 27 of the 2009 Volvo annual report below. You can navigate through the pages in the report by either clicking on the pages listed below, or by using the keyword search tool below to find specific information within the annual report.-
 1
1 -
2
-
3
-
4
-
5
-
6
-
7
-
8
-
9
-
10
-
11
-
12
-
13
-
14
-
15
-
16
-
 17
17 -
 18
18 -
 19
19 -
 20
20 -
 21
21 -
 22
22 -
 23
23 -
 24
24 -
 25
25 -
 26
26 -
 27
27 -
 28
28 -
 29
29 -
 30
30 -
 31
31 -
 32
32 -
 33
33 -
 34
34 -
 35
35 -
 36
36 -
 37
37 -
38
-
39
-
40
-
41
-
42
-
43
-
44
-
45
-
46
-
47
-
48
-
49
-
50
-
51
-
52
-
53
-
54
-
55
-
56
-
57
-
58
-
59
-
60
-
61
-
62
-
63
-
64
-
65
-
66
-
67
-
68
-
69
-
70
-
71
-
72
-
73
-
74
-
75
-
76
-
77
-
78
-
79
-
80
-
81
-
82
-
83
-
84
-
85
-
86
-
87
-
88
-
89
-
90
-
91
-
92
-
93
-
94
-
95
-
96
-
97
-
98
-
99
-
100
-
101
-
102
-
103
-
104
-
105
-
106
-
107
-
108
-
109
-
110
-
111
-
112
-
113
-
114
-
115
-
116
-
117
-
118
-
119
-
120
-
121
-
122
-
123
-
124
-
125
-
126
-
127
-
128
-
129
-
130
-
131
-
132
-
133
-
134
-
135
-
136
-
137
-
138
-
139
-
140
-
141
-
142
-
143
-
144
-
145
-
146
 |
 |

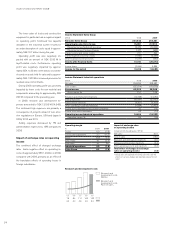
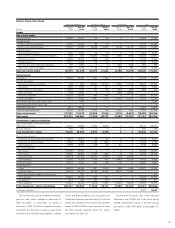
Net sales by business area
SEK M 2008 2009 %
Trucks 203,642 138,940 (32)
Construction
Equipment 56,277 35,658 (37)
Buses 17, 350 18,465 6
Volvo Penta 11, 518 8,159 (29)
Volvo Aero 7,625 7,803 2
Eliminations
and other (576) (538) (7)
Industrial
operations1295,836 208,487 (30)
Customer
Finance 11, 073 11,712 6
Reclassications
and eliminations (2,268) (1,838) –
Volvo Group 304,642 218,361 (28)
1 Adjusted for acquired and divested units and changes in
currency rates, net sales for Industrial operations
decreased by 37%.
Operating income (loss) by business area
SEK M 2008 2009
Trucks 12,167 (10,805)
Construction Equipment 1,808 (4,005)
Buses (76) (350)
Volvo Penta 928 (230)
Volvo Aero 359 50
Eliminations and other (732) (994)
Industrial operations 14,454 (16,333)
Customer Finance 1,397 (680)
Volvo Group 15,851 (17,013)
Net sales by market area
SEK M 2008 2009 %
Western Europe 124,261 84,452 (32)
Eastern Europe 28,212 9,632 (66)
North America 47,746 37,291 (22)
South America 19,613 16,610 (15)
Asia 55,812 44,842 (20)
Other markets 20,192 15,660 (22)
Total Industrial
operations 295,836 208,487 (30)
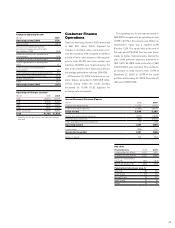
The Volvo Group
Net sales
Net sales for the Volvo Group decreased by
28% to SEK 218,361 M in 2009, compared to
SEK 304,642 M in 2008.
Operating income
Volvo Group operating loss amounted to SEK
17,013 M (income SEK 15,851 M).
Operating loss for the Industrial Operations
amounted to SEK 16,333 M compared to an
operating income of SEK 14,454 M in the pre-
ceding year. The Customer Finance operations
posted an operating loss of SEK 680 M
(income SEK 1,397 M).
Net financial items
Net interest expense was SEK 3,169 M, com-
pared with SEK 764 M in 2008. The increased
interest expense is mainly attributable to
increased debt level and it was also negatively
impacted by an increased interest expense for
post-employment benets.
During the year, market valuation of deriva-
tives, mainly used for the customer nancing
portfolio, had a negative effect on Other nan-
cial income and expenses in an amount of SEK
90 M (neg. SEK 1,029 M).
Income Taxes
The tax income for the year amounted to SEK
5,889 M. During 2008 the income tax expense
amounted to SEK 3,994 M and a tax rate of
29%.
Income for the period and earnings
per share
The loss for the period amounted to SEK
14,685 M (income SEK 10,016 M), cor-
responding to basic and diluted earnings per
share of a negative SEK 7.26 (positive SEK
4.90). The return of shareholders’ equity was
negative 19.7% (positive 12.1%).
Industrial Operations
In 2009, net sales for the Volvo Group’s Indus-
trial Operations decreased by 30% to SEK
208.487 M (295.836).
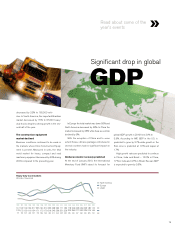
The nancial crisis and the downturn in the
global economy that started during the autumn
of 2008 continued to have a signicantly
nega tive impact on most of the Group’s mar-
kets in 2009. The main markets in Europe,
North America and Japan were very weak dur-
ing the rst half of the year. Towards the end of
the year, a modest recovery was noted, but the
markets were still on very low levels from
an historical perspective. China, India and
Brazil recovered relatively rapidly and grew
during the second half of the year, among
other things because of stimulus measures by
the governments.
Operating loss
In 2009, the operating loss for the Volvo
Group’s Industrial Operations amounted to
SEK 16,333 M, compared to an operating
income of SEK 14,454 M in 2008. The operating
margin for the Industrial Operations amounted
to a negative 7.8% (Positive 4.9%).
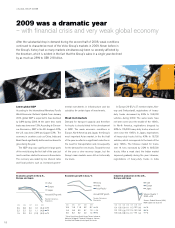
Net sales decreased by 28% to SEK 218.4 billion, while the operating loss amounted SEK
17.0 billion (Income: SEK 15.9 billion). The loss for the year amounted to SEK 14.7 billion,
compared to an income for the year of SEK 10.0 billion in 2008. Basic and diluted earnings
per share was a negative SEK 7.26 (Positive SEK 4.90).
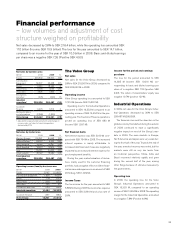
Financial performance
– low volumes and adjustment of cost
structure weighed on protability
23