Volvo 2009 Annual Report Download - page 35
Download and view the complete annual report
Please find page 35 of the 2009 Volvo annual report below. You can navigate through the pages in the report by either clicking on the pages listed below, or by using the keyword search tool below to find specific information within the annual report.-
 1
1 -
2
-
3
-
4
-
5
-
6
-
7
-
8
-
9
-
10
-
11
-
12
-
13
-
14
-
15
-
16
-
17
-
18
-
19
-
20
-
21
-
22
-
23
-
24
-
 25
25 -
 26
26 -
 27
27 -
 28
28 -
 29
29 -
 30
30 -
 31
31 -
 32
32 -
 33
33 -
 34
34 -
 35
35 -
 36
36 -
 37
37 -
 38
38 -
 39
39 -
 40
40 -
 41
41 -
 42
42 -
 43
43 -
 44
44 -
 45
45 -
46
-
47
-
48
-
49
-
50
-
51
-
52
-
53
-
54
-
55
-
56
-
57
-
58
-
59
-
60
-
61
-
62
-
63
-
64
-
65
-
66
-
67
-
68
-
69
-
70
-
71
-
72
-
73
-
74
-
75
-
76
-
77
-
78
-
79
-
80
-
81
-
82
-
83
-
84
-
85
-
86
-
87
-
88
-
89
-
90
-
91
-
92
-
93
-
94
-
95
-
96
-
97
-
98
-
99
-
100
-
101
-
102
-
103
-
104
-
105
-
106
-
107
-
108
-
109
-
110
-
111
-
112
-
113
-
114
-
115
-
116
-
117
-
118
-
119
-
120
-
121
-
122
-
123
-
124
-
125
-
126
-
127
-
128
-
129
-
130
-
131
-
132
-
133
-
134
-
135
-
136
-
137
-
138
-
139
-
140
-
141
-
142
-
143
-
144
-
145
-
146
 |
 |

(39.7)
08
(70.9)
09
23.7
05
29.2
06
(5.7)
07
40
10
(20)
(50)
(80)
1) Excluding adjustment of goodwill in 2006. A reversal of a valuation reserve for deferred taxes and an adjustment of goodwill is included in 2006. As an effect, operating income in 2006
was negatively affected in the amount of SEK 1,712 M, while income taxes decreased by SEK 2,048 M. The total effect on income for the period was positive in an amount of SEK 336 M.
5.2
08
(7.8)
09
7.9
05
8.9
06 07
7.8
1
(10)
10
0
6
08
(28)
09
14
05
7
06
10
07
(30)
0
10
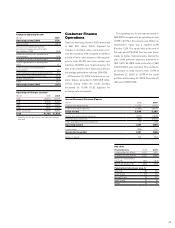
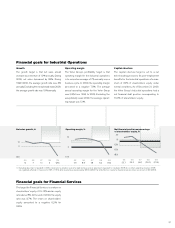
Growth
The growth target is that net sales should
increase by a minimum of 10% annually. During
2009, net sales decreased by 28%. During
1999–2009, the average growth rate was 6%
annually. Excluding the exceptionally weak 2009,
the average growth rate was 10% annually.
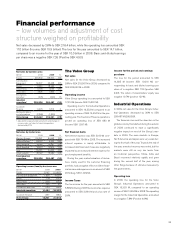
Operating margin
The Volvo Group’s protability target is that
operating margin for the Industrial operations
is to exceed an average of 7% annually over a
business cycle. In 2009, the operating margin
amounted to a negative 7.8%. The average
annual operating margin for the Volvo Group
was 3.9% from 1999 to 2009. Excluding the
exceptionally weak 2009, the average operat-
ing margin was 5.1%.
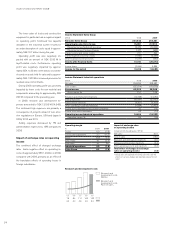
Capital structure
The capital structure target is set to a net
debt including provisions for post-employment
benets for the Industrial operations of a max-
imum of 40% of shareholders’ equity under
normal conditions. As of December 31, 2009,
the Volvo Group’s Industrial operations had a
net nancial debt position corresponding to
70.9% of shareholders’ equity.
Net sales growth, % Operating margin, % Net financial position as percentage
of shareholders’ equity, %
The target for Financial Services is a return on
shareholders’ equity of 12–15% and an equity
ratio above 8%. At the end of 2009, the equity
ratio was 8.7%. The return on shareholders’
equity amounted to a negative 6.2% for
2009.
Financial goals for Financial Services
Financial goals for Industrial Operations
31