Volvo 2009 Annual Report Download - page 108
Download and view the complete annual report
Please find page 108 of the 2009 Volvo annual report below. You can navigate through the pages in the report by either clicking on the pages listed below, or by using the keyword search tool below to find specific information within the annual report.-
 1
1 -
2
-
3
-
4
-
5
-
6
-
7
-
8
-
9
-
10
-
11
-
12
-
13
-
14
-
15
-
16
-
17
-
18
-
19
-
20
-
21
-
22
-
23
-
24
-
25
-
26
-
27
-
28
-
29
-
30
-
31
-
32
-
33
-
34
-
35
-
36
-
37
-
38
-
39
-
40
-
41
-
42
-
43
-
44
-
45
-
46
-
47
-
48
-
49
-
50
-
51
-
52
-
53
-
54
-
55
-
56
-
57
-
58
-
59
-
60
-
61
-
62
-
63
-
64
-
65
-
66
-
67
-
68
-
69
-
70
-
71
-
72
-
73
-
74
-
75
-
76
-
77
-
78
-
79
-
80
-
81
-
82
-
83
-
84
-
85
-
86
-
87
-
88
-
89
-
90
-
91
-
92
-
93
-
94
-
95
-
96
-
97
-
 98
98 -
 99
99 -
 100
100 -
 101
101 -
 102
102 -
 103
103 -
 104
104 -
 105
105 -
 106
106 -
 107
107 -
 108
108 -
 109
109 -
 110
110 -
 111
111 -
 112
112 -
 113
113 -
 114
114 -
 115
115 -
 116
116 -
 117
117 -
 118
118 -
119
-
120
-
121
-
122
-
123
-
124
-
125
-
126
-
127
-
128
-
129
-
130
-
131
-
132
-
133
-
134
-
135
-
136
-
137
-
138
-
139
-
140
-
141
-
142
-
143
-
144
-
145
-
146
 |
 |

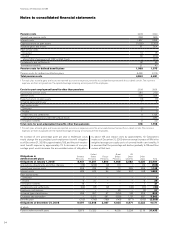
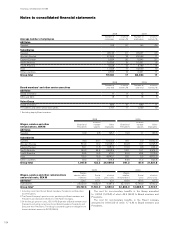
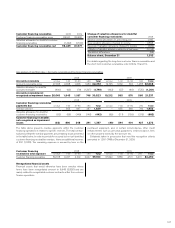
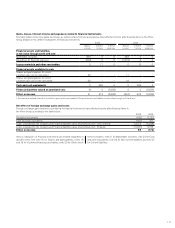
Notes to consolidated financial statements
2008 2009
Average number of employees Number of
employees of which
women, % Number of
employees of which
women, %
AB Volvo
Sweden 196 47 190 46
Subsidiaries
Sweden 28,126 21 23,637 20
Western Europe 27,584 18 25,533 17
Eastern Europe 5,694 20 5,542 21
North America 10,625 19 10,091 18
South America 4,328 13 4,180 14
Asia 17,924 11 16,650 10
Other countries 2,553 13 2,261 17
Group total 97,030 17 88,084 17
2008 2009
Board members1 and other senior executives Number at
year-end of which
women, % Number at
year-end of which
women, %
AB Volvo
Board members111 912 8
CEO and GEC 18 618 6
Volvo Group
Board members1885 10 880 11
Presidents and other senior executives 1,701 17 1,330 19
1 Excluding deputy Board members.
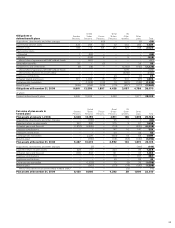
2008 2009
Wages, salaries and other
remunerations, SEK M Board and
Presidents1
of which
variable
salaries Other
employees Board and
Presidents1
of which
variable
salaries Other
employees
AB Volvo
Sweden 31.0 9.8 195.7 19.0 1.1 140.6
Subsidiaries
Sweden 78.3 30.7 11, 5 50 . 3 56.1 5.0 9,662.6
Western Europe 514.3 10.2 10,628.7 432.8 10.7 9,995.8
Eastern Europe 50.1 11. 8 1,087.2 110.0 9.6 904.2
North America 163.0 34.4 4,808.9 142.1 14.7 4,974.0
South America 26.5 16.5 974.1 43.5 29.4 1,015.9
Asia 125.3 16.6 4,840.1 93.1 5.6 4,602.9
Other countries 59.3 3.3 614.8 44.6 11. 5 625.8
Group total 1,047.8 133.3 34,699.8 941.2 87.6 31,921.8
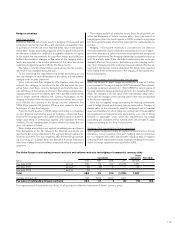
2008 2009
Wages, salaries and other remunerations
and social costs, SEK M
Wages,
salaries, remu-
nerations Social
costs of which
pens. costs
Wages,
salaries,
remunerations Social
costs of which
pens. costs
AB Volvo2226.7 107.1 62.1 159.6 139.5 107.5
Subsidiaries 35,520.9 11, 6 32 . 9 4,487.9 32,703.4 12,746 .0 4,593.2
Group total335,747.6 11,740.0 4,550.0 32,863.0 12,885.5 4,700.7
1 Including current and former Board members, Presidents and Executive
Vice Presidents.
2 The Parent Company’s pension costs, pertaining to Board members and
Presidents are disclosed in Note 21 in the Parent Company.
3 Of the Group’s pension costs, 135.1 (170.8) pertain to Board members and
Presidents, including current and former Board members, Presidents and
Executive Vice Presidents. The Group’s outstanding pension obligations to
these individuals amount to 267.2 (246.4).
The cost for non-monetary benefits in the Group amounted
to 1,300.0 (1,615.0) of which 49.3 (43.9) to Board members and
Presidents.
The cost for non-monetary benefits in the Parent company
amounted to 9.8 (13.0) of which 1.7 (1.8) to Board members and
Presidents.
FINANCIAL INFORMATION 2009
104