Volvo 2009 Annual Report Download - page 91
Download and view the complete annual report
Please find page 91 of the 2009 Volvo annual report below. You can navigate through the pages in the report by either clicking on the pages listed below, or by using the keyword search tool below to find specific information within the annual report.-
 1
1 -
2
-
3
-
4
-
5
-
6
-
7
-
8
-
9
-
10
-
11
-
12
-
13
-
14
-
15
-
16
-
17
-
18
-
19
-
20
-
21
-
22
-
23
-
24
-
25
-
26
-
27
-
28
-
29
-
30
-
31
-
32
-
33
-
34
-
35
-
36
-
37
-
38
-
39
-
40
-
41
-
42
-
43
-
44
-
45
-
46
-
47
-
48
-
49
-
50
-
51
-
52
-
53
-
54
-
55
-
56
-
57
-
58
-
59
-
60
-
61
-
62
-
63
-
64
-
65
-
66
-
67
-
68
-
69
-
70
-
71
-
72
-
73
-
74
-
75
-
76
-
77
-
78
-
79
-
80
-
 81
81 -
 82
82 -
 83
83 -
 84
84 -
 85
85 -
 86
86 -
 87
87 -
 88
88 -
 89
89 -
 90
90 -
 91
91 -
 92
92 -
 93
93 -
 94
94 -
 95
95 -
 96
96 -
 97
97 -
 98
98 -
 99
99 -
 100
100 -
 101
101 -
102
-
103
-
104
-
105
-
106
-
107
-
108
-
109
-
110
-
111
-
112
-
113
-
114
-
115
-
116
-
117
-
118
-
119
-
120
-
121
-
122
-
123
-
124
-
125
-
126
-
127
-
128
-
129
-
130
-
131
-
132
-
133
-
134
-
135
-
136
-
137
-
138
-
139
-
140
-
141
-
142
-
143
-
144
-
145
-
146
 |
 |
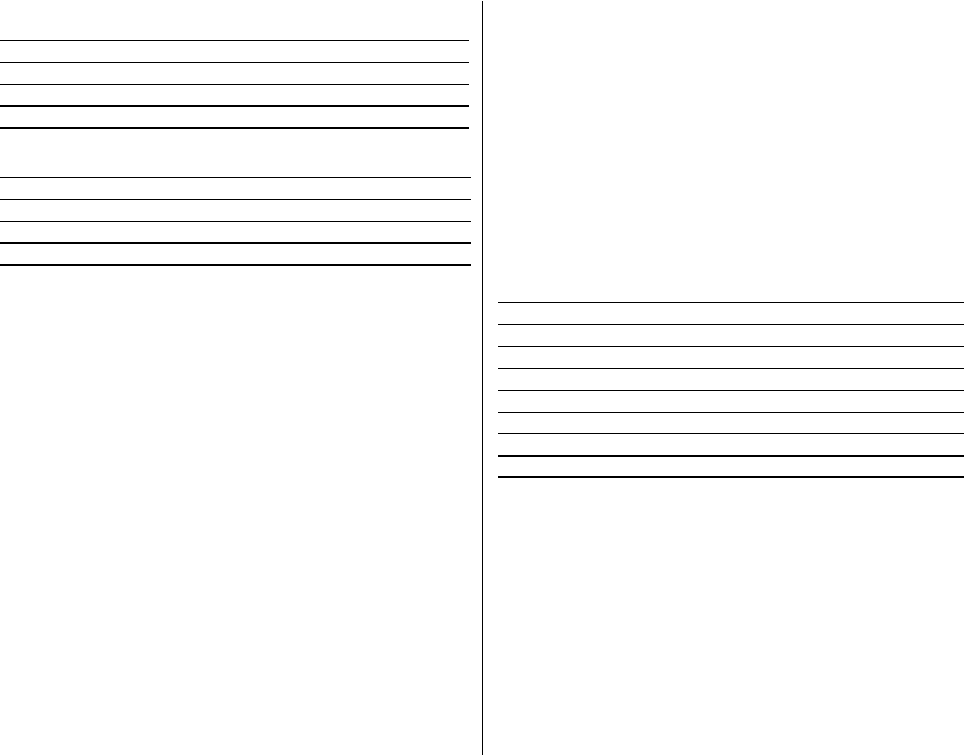
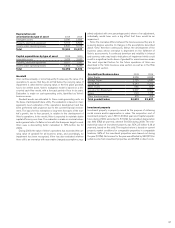
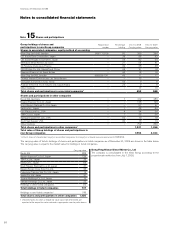
Depreciation and
amortization by type of asset 2008 2009
Intangible assets 3,286 3,589
Property, plant and equipment 5,718 6,562
Assets under operating leases 4,520 5,076
Total 13,524 15,227
Capital expenditures by type of asset 2008 2009
Intangible assets 2,875 2,935
Property, plant and equipment 9,977 7,392
Assets under operating leases 5,440 4,246
Total 18,292 14,573
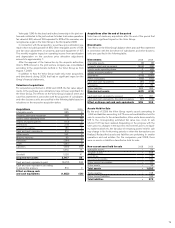
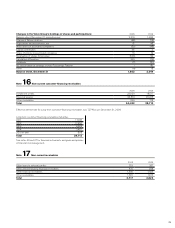
Goodwill
Volvo verifies annually, or more frequently if necessary, the value of its
operations to secure that they do not fall below the carrying value. If
impairment is detected the carrying value, in the first place goodwill,
has to be written down. Volvo’s evaluation model is based on a dis-
counted cash-flow model, with a forecast period of four to six years.
Evaluation is made on cash-generating units, identified as Volvo’s
business areas.
Goodwill assets are allocated to these cash-generating units on
the basis of anticipated future utility. The evaluation is based on man-
agement’s best estimation of the operations’ development and has
been performed with prudence due to the current financial environ-
ment. The basis for this estimation is long-term forecasts of the mar-
ket’s growth, two to four percent, in relation to the development of
Volvo’s operations. In the model, Volvo is expected to maintain stable
capital efficiency over time. The evaluation is made on nominal values
and a general rate of inflation in line with the European target is used.
Volvo uses a discounting factor calculated to 12% before tax for
2009.
During 2009, the value of Volvo’s operations has exceeded the car-
rying value of goodwill for all business areas, and accordingly, no
impairment has been recognized. Volvo has also evaluated whether
there still is an overvalue with reasonable changed assumptions, neg-
atively adjusted with one percentage point, where of no adjustment,
individually, would have such a big effect that there would be an
impairment.
Since the overvalue differs between the business areas they are to
a varying degree sensitive to changes in the assumptions described
above. Volvo therefore continuously follows the development of the
business areas whose overvalue is dependent on the fulfilment of
Volvo’s assessments. A continued downturn and volatility in interest
and currency rates may lead to indications of impairment which could
result in a significant write-down of goodwill for some business areas.
The most important factors for the future operations of Volvo are
described in the Volvo business area section, as well as in the Risk
management section.
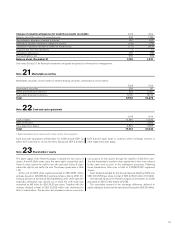
Goodwill per Business Area 2008 2009
Volvo Trucks 4,356 4,368
Renault Trucks 2,723 2,580
Trucks Asia 6,243 5,752
Mack Trucks 985 924
Construction Equipment 9,007 8,607
Buses 1,124 1,178
Other business areas 375 418
Total goodwill value 24,813 23,827
Investment property
Investment property is property owned for the purpose of obtaining
rental income and/or appreciation in value. The acquisition cost of
investment property was 1,681 (1,603) at year-end. Capital expendi-
tures during 2009 amounted to 87 (99). Accumulated depreciation
was 690 (582) at year-end, whereof 54 (50) during 2009. The esti-
mated fair value of investment property was SEK 2.5 billion (1.9) at
year-end, based on the yield. The required return is based on current
property market conditions for comparable properties in comparable
locations. 93% of the investment properties were leased out during
the year (100%). Net income for the year was affected by 268 (275) in
rental income from investment properties and 45 (50) in direct costs.
87