Volvo 2009 Annual Report Download - page 73
Download and view the complete annual report
Please find page 73 of the 2009 Volvo annual report below. You can navigate through the pages in the report by either clicking on the pages listed below, or by using the keyword search tool below to find specific information within the annual report.-
 1
1 -
2
-
3
-
4
-
5
-
6
-
7
-
8
-
9
-
10
-
11
-
12
-
13
-
14
-
15
-
16
-
17
-
18
-
19
-
20
-
21
-
22
-
23
-
24
-
25
-
26
-
27
-
28
-
29
-
30
-
31
-
32
-
33
-
34
-
35
-
36
-
37
-
38
-
39
-
40
-
41
-
42
-
43
-
44
-
45
-
46
-
47
-
48
-
49
-
50
-
51
-
52
-
53
-
54
-
55
-
56
-
57
-
58
-
59
-
60
-
61
-
62
-
 63
63 -
 64
64 -
 65
65 -
 66
66 -
 67
67 -
 68
68 -
 69
69 -
 70
70 -
 71
71 -
 72
72 -
 73
73 -
 74
74 -
 75
75 -
 76
76 -
 77
77 -
 78
78 -
 79
79 -
 80
80 -
 81
81 -
 82
82 -
 83
83 -
84
-
85
-
86
-
87
-
88
-
89
-
90
-
91
-
92
-
93
-
94
-
95
-
96
-
97
-
98
-
99
-
100
-
101
-
102
-
103
-
104
-
105
-
106
-
107
-
108
-
109
-
110
-
111
-
112
-
113
-
114
-
115
-
116
-
117
-
118
-
119
-
120
-
121
-
122
-
123
-
124
-
125
-
126
-
127
-
128
-
129
-
130
-
131
-
132
-
133
-
134
-
135
-
136
-
137
-
138
-
139
-
140
-
141
-
142
-
143
-
144
-
145
-
146
 |
 |

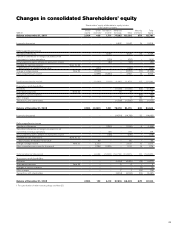
Changes in consolidated Shareholders’ equity
Shareholders’ equity attributable to equity holders
of the parent company
SEK M Share
capital Other
reserves1
Translation
reserve Retained
earnings Total Minority
interests Total
equity
Balance at December 31, 2007 2,554 435 1,711 77,502 82,202 579 82,781
Income for the period – – – 9,942 9,942 74 10,016
Other comprehensive income
Translation differences – – 6,126 –6,126 23 6,149
Translation differences on hedge instruments of net
investments in foreign operations – – (414) –(414) –(414)
Accumulated translation difference reversed to income – – (82) –(82) –(82)
Available-for-sale investments: Note 15, 23
Gains/losses at valuation to fair value – (459) – – (459) –(459)
Change in hedge reserve Note 23 –(2,239) – – (2,239) (10) (2,249)
Other comprehensive income (2,698) (5,630) – 2,932 13 2,945
Total income for the period –(2,698) 5,630 9,942 12,874 87 12,961
Transactions with shareholders
Dividends – – – (11,15 0) (11,15 0) (54) (11, 2 04)
Share based payments Note 34 – – – 73 73 –73
Changes in minority interests – – – – – (62) (62)
Other changes – – – 11 11 80 91
Transactions with shareholders (11,0 6 6) (11,0 6 6) (36) (11,10 2)
Balance at December 31, 2008 2,554 (2,263) 7,341 76,378 84,010 630 84,640
Income for the period – – – (14,718) (14,718) 33 (14,685)
Other comprehensive income
Translation differences – – (1,252) –(1,252) 6(1,246)
Translation differences on hedge instruments of net
investments in foreign operations – – 159 –159 –159
Accumulated translation difference reversed to income – – (136) –(136) –(136)
Available-for-sale investments: Note 15, 23
Gains/losses at valuation to fair value – 86 – – 86 –86
Change in hedge reserve Note 23 –2,300 – – 2,300 13 2,313
Other comprehensive income for the period – 2,386 (1,229) –1,157 19 1,176
Total income for the period –2,386 (1,229) (14,718) (13,561) 52 (13,509)
Transactions with shareholders
Dividends – – – (4,055) (4,055) (15) (4,070)
Share based payments Note 34 – – – 4 4 – 4
Changes in minority interests – – – – – (2) (2)
Other changes – – – 7 7 (36) (29)
Transactions with shareholders (4,044) (4,044) (53) (4,097)
Balance at December 31, 2009 2,554 123 6,112 57,616 66,405 629 67,034
1 For specification of other reserves please see Note 23.
69