Volvo 2009 Annual Report Download - page 55
Download and view the complete annual report
Please find page 55 of the 2009 Volvo annual report below. You can navigate through the pages in the report by either clicking on the pages listed below, or by using the keyword search tool below to find specific information within the annual report.-
 1
1 -
2
-
3
-
4
-
5
-
6
-
7
-
8
-
9
-
10
-
11
-
12
-
13
-
14
-
15
-
16
-
17
-
18
-
19
-
20
-
21
-
22
-
23
-
24
-
25
-
26
-
27
-
28
-
29
-
30
-
31
-
32
-
33
-
34
-
35
-
36
-
37
-
38
-
39
-
40
-
41
-
42
-
43
-
44
-
 45
45 -
 46
46 -
 47
47 -
 48
48 -
 49
49 -
 50
50 -
 51
51 -
 52
52 -
 53
53 -
 54
54 -
 55
55 -
 56
56 -
 57
57 -
 58
58 -
 59
59 -
 60
60 -
 61
61 -
 62
62 -
 63
63 -
 64
64 -
 65
65 -
66
-
67
-
68
-
69
-
70
-
71
-
72
-
73
-
74
-
75
-
76
-
77
-
78
-
79
-
80
-
81
-
82
-
83
-
84
-
85
-
86
-
87
-
88
-
89
-
90
-
91
-
92
-
93
-
94
-
95
-
96
-
97
-
98
-
99
-
100
-
101
-
102
-
103
-
104
-
105
-
106
-
107
-
108
-
109
-
110
-
111
-
112
-
113
-
114
-
115
-
116
-
117
-
118
-
119
-
120
-
121
-
122
-
123
-
124
-
125
-
126
-
127
-
128
-
129
-
130
-
131
-
132
-
133
-
134
-
135
-
136
-
137
-
138
-
139
-
140
-
141
-
142
-
143
-
144
-
145
-
146
 |
 |

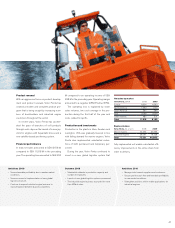
In spite of the downturn, VFS has made
strides in accordance with its long-term strat-
egies, including growth through geographical
expansion. In 2009, nancing operations com-
menced in Japan and Australia.
Financial performance
Total new nancing volume in 2009 amounted
to SEK 28.7 billion (44.5). Adjusted for
changes in exchange rates, new business vol-
ume decreased by 41% compared to 2008 as
a result of lower sales volumes of Group prod-
ucts. In total, 25,782 new Volvo vehicles and
machines (47,986) were nanced during the
year. In the markets where nancing is offered,
the average penetration rate was 25% (25).
On December 31, 2009, total assets in cus-
tomer nance amounted to SEK 98.8 billion
(117.6). During 2009 the credit portfolio
decreased by 15.6% (11.8), adjusted for
exchange-rate movements.
The operating loss for the year amounted to
SEK 680 M compared to an operating income
of SEK 1,397 M in the previous year. Return on
shareholders’ equity was a negative 6.2%
(Positive: 12.6). The equity ratio at the end of
the year was 8.7% (8.2). The loss was mainly
caused by higher credit provisions. During the
Outcome 2009
Renement of underwriting, portfolio management and •
remarketing processes.
Full liquidity & interest matching maintained. •
Developed integrated offers with the other business •
areas to reduce inventory levels and optimize cash flow.
Commenced customer nancing activities in Japan •
and Australia.
Developed and implemented global framework to •
secure key competencies.
Ambitions 2010
Support customer and dealer downturn activities •
while mitigating the frequency and severity of credit
losses.
Adapt commercial strategy to lessons learned from •
the downturn to achieve sustainable protability.
Operational improvement & efciency.•
Secure diversication of funding channels in •
cooperation with Volvo Treasury.
Ambitions 2009
Ensure sustained protability in the global recession. •
Secure efcient funding and execute on capital •
management strategies.
Continue optimizing growth by more tailored customer •
solutions.
Secure key competencies and global mobility.•
year, credit provision expenses amounted to
SEK 2,327 M (483) while write-offs of SEK
2,223 M (521) were recorded. This resulted in
an increase in credit reserves from 1.37% on
December 31, 2008, to 1.67% of the credit
portfolio on December 31, 2009. The write-off
ratio was 2.09% (0.54).
51