Volvo 2009 Annual Report Download - page 90
Download and view the complete annual report
Please find page 90 of the 2009 Volvo annual report below. You can navigate through the pages in the report by either clicking on the pages listed below, or by using the keyword search tool below to find specific information within the annual report.-
 1
1 -
2
-
3
-
4
-
5
-
6
-
7
-
8
-
9
-
10
-
11
-
12
-
13
-
14
-
15
-
16
-
17
-
18
-
19
-
20
-
21
-
22
-
23
-
24
-
25
-
26
-
27
-
28
-
29
-
30
-
31
-
32
-
33
-
34
-
35
-
36
-
37
-
38
-
39
-
40
-
41
-
42
-
43
-
44
-
45
-
46
-
47
-
48
-
49
-
50
-
51
-
52
-
53
-
54
-
55
-
56
-
57
-
58
-
59
-
60
-
61
-
62
-
63
-
64
-
65
-
66
-
67
-
68
-
69
-
70
-
71
-
72
-
73
-
74
-
75
-
76
-
77
-
78
-
79
-
 80
80 -
 81
81 -
 82
82 -
 83
83 -
 84
84 -
 85
85 -
 86
86 -
 87
87 -
 88
88 -
 89
89 -
 90
90 -
 91
91 -
 92
92 -
 93
93 -
 94
94 -
 95
95 -
 96
96 -
 97
97 -
 98
98 -
 99
99 -
 100
100 -
101
-
102
-
103
-
104
-
105
-
106
-
107
-
108
-
109
-
110
-
111
-
112
-
113
-
114
-
115
-
116
-
117
-
118
-
119
-
120
-
121
-
122
-
123
-
124
-
125
-
126
-
127
-
128
-
129
-
130
-
131
-
132
-
133
-
134
-
135
-
136
-
137
-
138
-
139
-
140
-
141
-
142
-
143
-
144
-
145
-
146
 |
 |
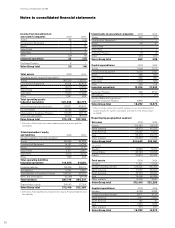
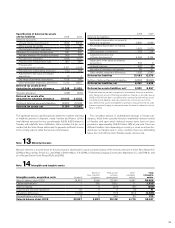
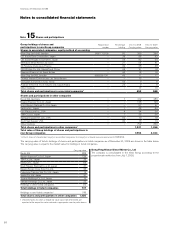
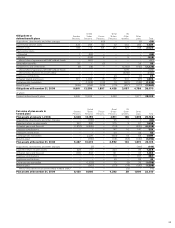
Notes to consolidated financial statements
Accumulated depreciation and amortization Goodwill
Entrance
fees, industrial
programs
Product and
software
development
Other
intangible
assets
Total
intangible
assets
Value in balance sheet 2008 –1,699 10,909 2,093 14,701
Depreciation and amortization –63 3,126 400 3,589
Sales/scrapping – 0 (260) (66) (326)
Acquired and divested operations4– 0 0 0 0
Translation differences – 0 (256) (78) (334)
Reclassifications and other – 0 220 49 269
Value in balance sheet 2009 01,762 13,739 2,398 17,899
Net carrying value in balance sheet 2008524,813 1,870 12,381 4,894 43,958
Net carrying value in balance sheet 2009523,827 2,071 11,409 4,321 41,628
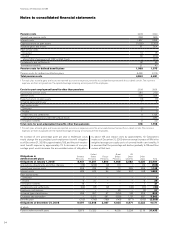
Tangible assets,
acquisition costs Buildings Land and land
improvements Machinery
and equipment6
Construction
in progress,
including
advance
payments
Total
investment
property,
property,
plant and
equipment
Assets under
operating
leases
Total
tangible
assets
Value in balance sheet 2008 31,897 12,701 69,144 5,347 119,089 37,582 156,671
Capital expenditures31,431 302 4,467 1,192 7,392 4,246 11,638
Sales/scrapping (510) (139) (2,495) (10) (3,154) (6,197) (9,351)
Acquired and divested operations4(3) 0(52) 0(55) (12) (67)
Translation differences (1,286) (768) (2,054) (89) (4,197) (1,251) (5,448)
Reclassifications and other 330 545 (159) (1,862) (1,146) (2,375) (3,521)
Value in balance sheet 2009 31,859 12,641 68,851 4,578 117,929 31,993 149,922
Accumulated depreciation
and amortization Buildings Land and land
improvements Machinery
and equipment6
Construction
in progress,
including
advance
payments
Total
investment
property,
property,
plant and
equipment
Assets under
operating
leases
Total
tangible
assets
Value in balance sheet 2008 14,804 671 46,344 –61,819 12,153 73,972
Depreciation and amortization71,236 118 5,208 –6,562 5,076 11,638
Sales/scrapping (277) (12) (2,217) –(2,506) (3,004) (5,510)
Acquired and divested operations40 0 0 – 011 11
Translation differences (609) (27) (1,579) –(2,215) (507) (2,722)
Reclassifications and other (374) 292 (929) –(1,011) (2,124) (3,135)
Value in balance sheet 2009 14,780 1,042 46,827 –62,649 11,605 74,254
Net carrying value in balance
sheet 2008517,093 12,030 22,800 5,347 57,270 25,429 82,699
Net carrying value in balance
sheet 20095, 8 17,079 11,599 22,024 4,578 55,280 20,388 75,668
1 Includes on the date of IFRS adoption, acquisition costs of 14,184 and
accumulated amortization of 3,863.
2 Other intangible assets mainly consists of trademarks and distribution net-
works.
3 Includes capitalized borrowing costs of 73.
4 Includes subsidiaries and joint ventures that previously were accounted for
according to the equity method.
5 Acquisition costs less accumulated depreciation, amortization and write-
downs.
6 Machinery and equipment pertains mainly to production equipment.
7 Of which write-down 221 (57).
8 Whereof Investment property 991 and Property, plant and equipment
54,289.
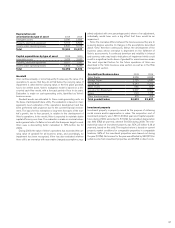
“Reclassifications and other” mainly consist of “assets under operat-
ing leases” related to legal sales transactions, where revenue is
deferred and accounted for as operating lease revenue. Assets clas-
sified as inventory will, when the operating lease model is applied for
revenue recognition, be reclassified from “inventory” to “assets under
operating leases”, when the legal sales transaction occurs. If the prod-
uct is returned after the lease period, there will again be a reclassifica-
tion from “assets under operating leases” to “inventory”. When a buy-
back agreement has expired, but the related product is not returned,
the acquisition cost and the accumulated depreciation are reversed in
“reclassification and other”, within the line item “assets under operat-
ing leases”. Some of the reclassifications within tangible assets relate
to construction in progress, which are reclassified to the respective
category within property, plant and equipment.
FINANCIAL INFORMATION 2009
86