Volvo 2009 Annual Report Download - page 22
Download and view the complete annual report
Please find page 22 of the 2009 Volvo annual report below. You can navigate through the pages in the report by either clicking on the pages listed below, or by using the keyword search tool below to find specific information within the annual report.-
 1
1 -
2
-
3
-
4
-
5
-
6
-
7
-
8
-
9
-
10
-
11
-
 12
12 -
 13
13 -
 14
14 -
 15
15 -
 16
16 -
 17
17 -
 18
18 -
 19
19 -
 20
20 -
 21
21 -
 22
22 -
 23
23 -
 24
24 -
 25
25 -
 26
26 -
 27
27 -
 28
28 -
 29
29 -
 30
30 -
 31
31 -
 32
32 -
33
-
34
-
35
-
36
-
37
-
38
-
39
-
40
-
41
-
42
-
43
-
44
-
45
-
46
-
47
-
48
-
49
-
50
-
51
-
52
-
53
-
54
-
55
-
56
-
57
-
58
-
59
-
60
-
61
-
62
-
63
-
64
-
65
-
66
-
67
-
68
-
69
-
70
-
71
-
72
-
73
-
74
-
75
-
76
-
77
-
78
-
79
-
80
-
81
-
82
-
83
-
84
-
85
-
86
-
87
-
88
-
89
-
90
-
91
-
92
-
93
-
94
-
95
-
96
-
97
-
98
-
99
-
100
-
101
-
102
-
103
-
104
-
105
-
106
-
107
-
108
-
109
-
110
-
111
-
112
-
113
-
114
-
115
-
116
-
117
-
118
-
119
-
120
-
121
-
122
-
123
-
124
-
125
-
126
-
127
-
128
-
129
-
130
-
131
-
132
-
133
-
134
-
135
-
136
-
137
-
138
-
139
-
140
-
141
-
142
-
143
-
144
-
145
-
146
 |
 |

A GLOBAL GROUP 2009
USA
Annual GDP-growth
Source: Consensus
Economics
Europe
Japan
0908070605
(4.0)1.13.03.32.2
(2.4) %
(5.3)(1.2)2.32.01.9 %
%
1.22.02.82.9
China
India
Asia/Pacific*
Annual BNP growth
Source: Consensus
Economics
0908070605
8.7
9.211.911.610.4
7.0
6.79.09.69.4
1.4
%
%
%
4.06.26.25.6
* China, Hong Kong, South Korea, Taiwan, Indonesia,
Malaysia, Singapore, Thailand, Phillippines, Vietnam,
Australia, New Zealand, India, Japan, Sri Lanka
USA
Europe
Japan
Volume, Quarter 1
2003 =100
Sources: Federal Reserve (USA),
METI (Japan) och Eurostat
0908060503
%
%
%
04 07
99
96
94
103
103
99
113
114
117
111
112
114
109
106
108
105
103
105
101
101
103
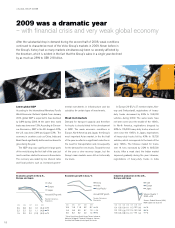
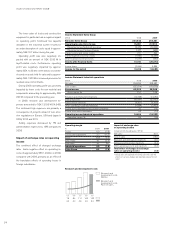
After the substantial drop in demand during the second half of 2008, weak conditions
continued to characterize most of the Volvo Group’s markets in 2009. Never before in
the Group’s history had so many markets simultaneously been so severely affected by
the downturn, which is evident in the fact that the Group’s sales in a single year declined
by as much as 28% to SEK 218 billion.
2009 was a dramatic year
– with nancial crisis and very weak global economy
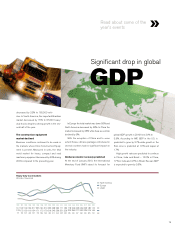
Lower global GDP
According to the International Monetary Fund’s
World Economic Outlook Update from January
2010, global GDP is expected to have declined
by 0.8% during 2009. At the same time, world
trade was down over 12%. According to Consen-
sus Economics, GDP in the EU dropped 4.0%,
the U.S. was down 2.4% and Japan 5.3%. The
economy in countries such as China, India and
Brazil fared signicantly better and continued to
grow during the year.
The GDP drop was signicant in large parts
of the world during the rst half of the year, but
most countries started to recover in the autumn.
The recovery was aided by low interest rates
and scal policies such as increased govern-
mental investments in infrastructure and tax
subsidies for certain types of investments.
Weak truck markets
Demand for transport capacity and therefore
for trucks is closely linked to the development
in GDP. The weak economic conditions in
Europe, North America and Japan, the Group’s
most important Asian market, in the rst half
of the year resulted in a signicant reduction in
the need for transportation and consequently
for the demand for new trucks. Toward the end
of the year a slow recovery began, but the
Group’s main markets were still on historically
low levels.
In Europe 29 (EU’s 27 member states, Nor-
way and Switzerland), registrations of heavy-
duty trucks decreased by 49% to 164,000
vehicles during 2009. The same levels have
not been seen since the middle of the 1990’s.
In North America, registrations dropped by
38% to 115,000 heavy-duty trucks, a level not
seen since the 1980’s. In Japan, registrations
of heavy-duty trucks fell by 43% to 18,700
vehicles, which corresponds to the levels of the
early 1960’s. The Chinese market for trucks
over 14 tons increased by 22% to 605,500
trucks. After a weak start, the Indian market
improved gradually during the year. However,
registrations of heavy-duty trucks in India
Economic growth in the U.S.,
Europe and Japan
Economic growth in Asia, % Industrial production in the U.S.,
Europe and Japan
18