Volvo 2009 Annual Report Download - page 120
Download and view the complete annual report
Please find page 120 of the 2009 Volvo annual report below. You can navigate through the pages in the report by either clicking on the pages listed below, or by using the keyword search tool below to find specific information within the annual report.-
 1
1 -
2
-
3
-
4
-
5
-
6
-
7
-
8
-
9
-
10
-
11
-
12
-
13
-
14
-
15
-
16
-
17
-
18
-
19
-
20
-
21
-
22
-
23
-
24
-
25
-
26
-
27
-
28
-
29
-
30
-
31
-
32
-
33
-
34
-
35
-
36
-
37
-
38
-
39
-
40
-
41
-
42
-
43
-
44
-
45
-
46
-
47
-
48
-
49
-
50
-
51
-
52
-
53
-
54
-
55
-
56
-
57
-
58
-
59
-
60
-
61
-
62
-
63
-
64
-
65
-
66
-
67
-
68
-
69
-
70
-
71
-
72
-
73
-
74
-
75
-
76
-
77
-
78
-
79
-
80
-
81
-
82
-
83
-
84
-
85
-
86
-
87
-
88
-
89
-
90
-
91
-
92
-
93
-
94
-
95
-
96
-
97
-
98
-
99
-
100
-
101
-
102
-
103
-
104
-
105
-
106
-
107
-
108
-
109
-
 110
110 -
 111
111 -
 112
112 -
 113
113 -
 114
114 -
 115
115 -
 116
116 -
 117
117 -
 118
118 -
 119
119 -
 120
120 -
 121
121 -
 122
122 -
 123
123 -
 124
124 -
 125
125 -
 126
126 -
 127
127 -
 128
128 -
 129
129 -
 130
130 -
131
-
132
-
133
-
134
-
135
-
136
-
137
-
138
-
139
-
140
-
141
-
142
-
143
-
144
-
145
-
146
 |
 |

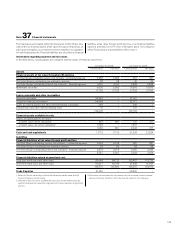
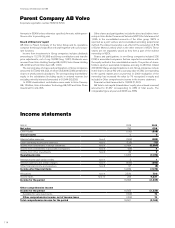
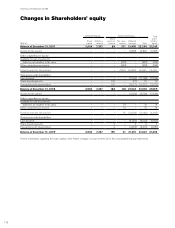
Changes in Shareholders’ equity
SEK M
Restricted equity Unrestricted equity Total
share-
holders’
equity
Share
capital Statutory
reserve
Share
premium
reserve Fair value
reserve Retained
earnings Total
Balance at December 31, 2007 2,554 7,337 88 271 21,895 22,254 32,145
Income for the period – – – – 16,825 16,825 16,825
Other comprehensive income
Available-for-sale investments:
Gain/loss at valuation to fair value – – – (324) –(324) (324)
Other comprehensive income – – – (324) –(324) (324)
Total income for the period – – – (324) 16,825 16,501 16,501
Transactions with shareholders
Cash dividend – – – – (11,150) (11,150) (11,150)
Share-based payments – – 100 –(27) 73 73
Transactions with shareholders – – 100 –(11,177 ) (11, 077) (11, 077)
Balance at December 31, 2008 2,554 7,337 188 (53) 27,543 27,678 37,569
Income for the period - – – – (2,239) (2,239) (2,239)
Other comprehensive income
Available-for-sale investments:
Gain/loss at valuation to fair value – – – 74 –74 74
Other comprehensive income – – – 74 –74 74
Total income for the period – – – 74 (2,239) (2,165) (2,165)
Transactions with shareholders
Cash dividend – – – – (4,055) (4,055) (4,055)
Share-based payments – – 2 – 2 4 4
Transactions with shareholders – – 2 – (4,053) (4,051) (4,051)
Balance at December 31, 2009 2,554 7,337 190 21 21,251 21,462 31,353
Further information regarding the share capital of the Parent company is shown in Note 23 to the consolidated financial statements.
FINANCIAL INFORMATION 2009
116