Volvo 2009 Annual Report Download - page 5
Download and view the complete annual report
Please find page 5 of the 2009 Volvo annual report below. You can navigate through the pages in the report by either clicking on the pages listed below, or by using the keyword search tool below to find specific information within the annual report.-
 1
1 -
 2
2 -
 3
3 -
 4
4 -
 5
5 -
 6
6 -
 7
7 -
 8
8 -
 9
9 -
 10
10 -
 11
11 -
 12
12 -
 13
13 -
 14
14 -
 15
15 -
 16
16 -
 17
17 -
 18
18 -
 19
19 -
 20
20 -
 21
21 -
 22
22 -
 23
23 -
 24
24 -
 25
25 -
 26
26 -
 27
27 -
 28
28 -
 29
29 -
 30
30 -
 31
31 -
 32
32 -
 33
33 -
 34
34 -
 35
35 -
 36
36 -
 37
37 -
 38
38 -
 39
39 -
 40
40 -
 41
41 -
 42
42 -
 43
43 -
 44
44 -
 45
45 -
 46
46 -
 47
47 -
 48
48 -
 49
49 -
 50
50 -
 51
51 -
 52
52 -
 53
53 -
 54
54 -
 55
55 -
 56
56 -
 57
57 -
 58
58 -
 59
59 -
 60
60 -
 61
61 -
 62
62 -
 63
63 -
 64
64 -
 65
65 -
 66
66 -
 67
67 -
 68
68 -
 69
69 -
 70
70 -
 71
71 -
 72
72 -
 73
73 -
 74
74 -
 75
75 -
 76
76 -
 77
77 -
 78
78 -
 79
79 -
 80
80 -
 81
81 -
 82
82 -
 83
83 -
 84
84 -
 85
85 -
 86
86 -
 87
87 -
 88
88 -
 89
89 -
 90
90 -
 91
91 -
 92
92 -
 93
93 -
 94
94 -
 95
95 -
 96
96 -
 97
97 -
 98
98 -
 99
99 -
 100
100 -
 101
101 -
 102
102 -
 103
103 -
 104
104 -
 105
105 -
 106
106 -
 107
107 -
 108
108 -
 109
109 -
 110
110 -
 111
111 -
 112
112 -
 113
113 -
 114
114 -
 115
115 -
 116
116 -
 117
117 -
 118
118 -
 119
119 -
 120
120 -
 121
121 -
 122
122 -
 123
123 -
 124
124 -
 125
125 -
 126
126 -
 127
127 -
 128
128 -
 129
129 -
 130
130 -
 131
131 -
 132
132 -
 133
133 -
 134
134 -
 135
135 -
 136
136 -
 137
137 -
 138
138 -
 139
139 -
 140
140 -
 141
141 -
 142
142 -
 143
143 -
 144
144 -
 145
145 -
 146
146
 |
 |

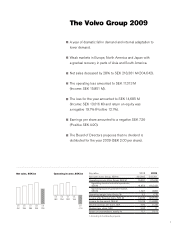
The Volvo Group 2009
Net sales, SEK bn Operating income, SEK bn
0908070605
218305285259241
08070605
15.922.220.418.2
09
–17.
0
Key ratios 2008 2009
Net sales Volvo Group, SEK M 304,642 218,361
Operating income Volvo Group, SEK M 15,851 (17,013)
Operating income Industrial operations,
SEK M 14,454 (16,333)
Operating income Customer Finance,
SEK M 1,397 (680)
Operating margin Volvo Group, % 5.2 (7.8)
Income after nancial items, SEK M 14,010 (20,573)
Income for the period, SEK M 10,016 (14,685)
Diluted earnings per share, SEK 4.90 (7.26)
Dividend per share, SEK 2.00 01
Return on shareholders' equity, % 12.1 (19.7)
1 According to the Board’s proposal.
A year of dramatic fall in demand and internal adaptation to
lower demand.
Weak markets in Europe, North America and Japan with
a gradual recovery in parts of Asia and South America.
Net sales deceased by 28% to SEK 218,361 M (304,642).
The operating loss amounted to SEK 17,013 M
(Income: SEK 15,851 M).
The loss for the year amounted to SEK 14,685 M
(Income: SEK 10,016 M) and return on equity was
a negative 19.7% (Positive 12.1%).
Earnings per share amounted to a negative SEK 7.26
(Positive SEK 4.90).
The Board of Directors proposes that no dividend is
distributed for the year 2009 (SEK 2.00 per share).
1
