Volvo 2009 Annual Report Download - page 83
Download and view the complete annual report
Please find page 83 of the 2009 Volvo annual report below. You can navigate through the pages in the report by either clicking on the pages listed below, or by using the keyword search tool below to find specific information within the annual report.
Volvo paid 1,845 for the direct and indirect ownership in the joint ven-
ture and contributed to the joint venture its Indian truck sales operations
fair valued at 530, whereof 234 equivalent to 50% of the overvalue, was
recognized as a gain in the Volvo Group in the third quarter 2008.
In connection with the acquisition, a purchase price allocation was
made which included goodwill of 855, other intangible assets of 564
and fair value adjustments on property, plant and equipment of 157.
The monthly negative impact on operating income from amortization
and depreciation on the purchase price allocation adjustments
amounts to approximately 7.
After the approval of the transaction by the requisite authorities,
Volvo’s 50% interest in the joint-venture company was consolidated
according to the proportionate method in the Volvo Group as from
August 1, 2008.
In addition to that, the Volvo Group made only minor acquisitions
and divestments during 2008, that had no significant impact on the
Group’s financial statements.
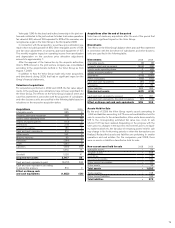
Valuation of acquisitions
For acquisitions performed in 2009 and 2008, the fair value adjust-
ments to the purchase price allocations have not been significant for
the Volvo Group. The effects on the Volvo Group’s balance sheet and
cash flow statement in connection with the acquisition of subsidiaries
and other business units are specified in the following table based on
valuations on the respective acquisition dates:
Acquisitions 2008 2009
Intangible assets 585 3
Property, plant and equipment 898 4
Assets under operating lease 019
Shares and participations (113) 0
Inventories 278 20
Current receivables 186 2
Cash and cash equivalents 819 0
Other assets 261 9
Minority interests 95 0
Provisions (284) 6
Loans (347) 0
Liabilities (499) (48)
1,879 15
Goodwill 1,028 41
Acquired net assets 2,907 56
Cash and cash equivalents paid (2,672) (56)
Cash and cash equivalents according
to acquisition analysis 819 0
Effect on Group cash
and cash equivalents (1,853) (56)
Acquisitions after the end of the period
Volvo has not made any acquisitions after the end of the period that
have had a significant impact on the Volvo Group.
Divestments
The effects on the Volvo Group’s balance sheet and cash-flow statement
in connection with the divestment of subsidiaries and other business
units are specified in the following table:
Divestments 2008 2009
Intangible assets (3) (3)
Property, plant and equipment (445) (59)
Assets under operating lease 0(42)
Shares and participations 065
Inventories (513) (280)
Other receivables (90) (112)
Cash and cash equivalents (41) (116)
Provisions 21 80
Other liabilities 644 254
Divested net assets (427) (213)
Cash and cash equivalents received 577 321
Cash and cash equivalents, divested companies (41) (116)
Effect on Group cash and cash equivalents 536 205
Assets Held for Sale
By the end of 2009 the Volvo Group reports assets amounting to
1,692 and liabilities amounting to 272 as assets and liabilities held for
sale. In connection to the reclassification, Volvo wrote down assets by
515 to the corresponding estimated fair value less costs to sell,
whereof 147 has been realized. Depending on the progress with the
sales process, changes in the business environment, access to liquid-
ity, market outlook etc, the fair value of remaining assets held for sale
may change in the forthcoming periods or when the transactions are
finalized. Reclassified assets and liabilities are pertaining to smaller
operations and real estates. For the comparison year 2008, there
were no assets or liabilities classified as held for sale.
Non-current asset held for sale 2008 2009
Intangible assets –54
Tangible assets –618
Inventories –776
Accounts receivable –109
Other current receivables –111
Other assets –24
Total assets –1,692
Trade payables –108
Other current liabilities – 164
Total liabilities –272
79


