Volvo 2009 Annual Report Download - page 96
Download and view the complete annual report
Please find page 96 of the 2009 Volvo annual report below. You can navigate through the pages in the report by either clicking on the pages listed below, or by using the keyword search tool below to find specific information within the annual report.-
 1
1 -
2
-
3
-
4
-
5
-
6
-
7
-
8
-
9
-
10
-
11
-
12
-
13
-
14
-
15
-
16
-
17
-
18
-
19
-
20
-
21
-
22
-
23
-
24
-
25
-
26
-
27
-
28
-
29
-
30
-
31
-
32
-
33
-
34
-
35
-
36
-
37
-
38
-
39
-
40
-
41
-
42
-
43
-
44
-
45
-
46
-
47
-
48
-
49
-
50
-
51
-
52
-
53
-
54
-
55
-
56
-
57
-
58
-
59
-
60
-
61
-
62
-
63
-
64
-
65
-
66
-
67
-
68
-
69
-
70
-
71
-
72
-
73
-
74
-
75
-
76
-
77
-
78
-
79
-
80
-
81
-
82
-
83
-
84
-
85
-
 86
86 -
 87
87 -
 88
88 -
 89
89 -
 90
90 -
 91
91 -
 92
92 -
 93
93 -
 94
94 -
 95
95 -
 96
96 -
 97
97 -
 98
98 -
 99
99 -
 100
100 -
 101
101 -
 102
102 -
 103
103 -
 104
104 -
 105
105 -
 106
106 -
107
-
108
-
109
-
110
-
111
-
112
-
113
-
114
-
115
-
116
-
117
-
118
-
119
-
120
-
121
-
122
-
123
-
124
-
125
-
126
-
127
-
128
-
129
-
130
-
131
-
132
-
133
-
134
-
135
-
136
-
137
-
138
-
139
-
140
-
141
-
142
-
143
-
144
-
145
-
146
 |
 |

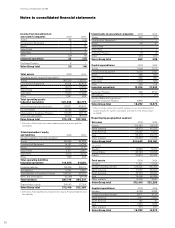
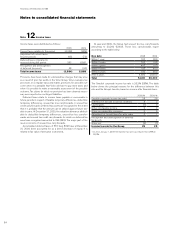
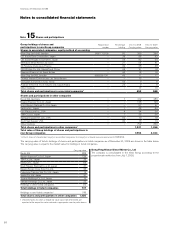
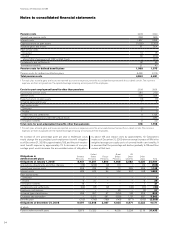
Notes to consolidated financial statements
Information regarding number of shares 2008 2009
Own Series A shares 20,728,135 20,728,135
Own Series B shares 80,310,082 80,265,060
Total own shares 101,038,217 100,993,195
Own shares in % of total registered shares 4.75 4.74
Outstanding Series A shares 656,873,495 656,873,495
Outstanding Series B shares 1,370,508,508 1,370,553,530
Total outstanding shares 2,027,382,003 2 ,027,427,025
Total registered Series A shares 677,601,630 677,601,630
Total registered Series B shares 1,450,818,590 1,450,818,590
Total registered shares 2,128,420,220 2,128,420,220
Average number of outstanding shares 2,026,977,937 2,027,419,396
Changes in outstanding Volvo shares
Balance December 31, 2008 2,027,382,003
Share-based incentive program 45,022
2,027,427,025
Change in other reserves (SEK M) Hedge reserve Available- for-
sale reserve Total
Balance at January 1, 2009 (2,057) (206) (2,263)
Change in fair value of contracts hedging currency risks (259) –(259)
Tax on change in fair value of contracts hedging currency risks 68 –68
Transfers to income 3,346 –3,346
Tax on transfers to income statement (880) –(880)
Change in fair value of commodity contracts 25 –25
Fair value adjustments regarding holding in Deutz –74 74
Fair value adjustments regarding shares held by UD Trucks – 1 1
Fair value adjustments regarding holding in Vindic AB – 11 11
Balance at December 31, 2009 243 (120) 123
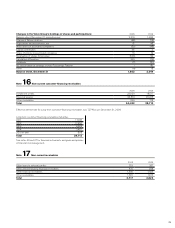
Earnings per share
Earnings per share are calculated as income for the period, attribut-
able to the Parent Company’s shareholders, divided by the Parent
Company’s average number of shares outstanding for the fiscal year.
Diluted earnings per share is calculated as income for the period
attributable to the Parent Company’s shareholders divided by the
average number of shares outstanding plus the average number of
shares that would be issued as an effect of ongoing share-based
incentive programs and employee stock option programs. If during the
year there were potential shares redeemed or expired during the
period, these are also included in the average number of shares used
to calculate the earnings per share after dilution.
The share-based incentive program creates a dilution effect when
the non-market-based financial goals are achieved for the fiscal year.
Similarly, the employee stock option program creates a dilution effect
by taking into account the difference between the exercise price and
the share’s average market price to determine how many shares that
are assumed to be issued without any payment. It is solely this number
of shares that have an effect on the calculated diluted earnings. The
number of shares that this value symbolizes is less than the total
potential number of shares attributable to the employee stock option
program.
2008 2009
Number of shares, December 31, in millions 2,027 2,027
Average number of shares
before dilution in millions 2,027 2,027
Average number of shares after
dilution in millions 2,027 2,027
Average share price, SEK 73.80 53.65
Net income attributable to
Parent Company shareholders 9,942 (14,718)
Basic earnings per share, SEK 4.90 (7.26)
Diluted earnings per share, SEK 4.90 (7.26)
Dilution effect, number of shares
Share-based incentive program – –
Employee stock option program 188,822 –
Number of potential shares, December 31 188,822 –
The share-based incentive program is implemented if certain non-mar-
ket-based financial goals are fulfilled partly or wholly. The requirement for
2009 was not met. No other transactions have occurred that affected, or
will have an effect on, the compilation of the reported share capital.
FINANCIAL INFORMATION 2009
92