Volvo 2009 Annual Report Download - page 86
Download and view the complete annual report
Please find page 86 of the 2009 Volvo annual report below. You can navigate through the pages in the report by either clicking on the pages listed below, or by using the keyword search tool below to find specific information within the annual report.-
 1
1 -
2
-
3
-
4
-
5
-
6
-
7
-
8
-
9
-
10
-
11
-
12
-
13
-
14
-
15
-
16
-
17
-
18
-
19
-
20
-
21
-
22
-
23
-
24
-
25
-
26
-
27
-
28
-
29
-
30
-
31
-
32
-
33
-
34
-
35
-
36
-
37
-
38
-
39
-
40
-
41
-
42
-
43
-
44
-
45
-
46
-
47
-
48
-
49
-
50
-
51
-
52
-
53
-
54
-
55
-
56
-
57
-
58
-
59
-
60
-
61
-
62
-
63
-
64
-
65
-
66
-
67
-
68
-
69
-
70
-
71
-
72
-
73
-
74
-
75
-
 76
76 -
 77
77 -
 78
78 -
 79
79 -
 80
80 -
 81
81 -
 82
82 -
 83
83 -
 84
84 -
 85
85 -
 86
86 -
 87
87 -
 88
88 -
 89
89 -
 90
90 -
 91
91 -
 92
92 -
 93
93 -
 94
94 -
 95
95 -
 96
96 -
97
-
98
-
99
-
100
-
101
-
102
-
103
-
104
-
105
-
106
-
107
-
108
-
109
-
110
-
111
-
112
-
113
-
114
-
115
-
116
-
117
-
118
-
119
-
120
-
121
-
122
-
123
-
124
-
125
-
126
-
127
-
128
-
129
-
130
-
131
-
132
-
133
-
134
-
135
-
136
-
137
-
138
-
139
-
140
-
141
-
142
-
143
-
144
-
145
-
146
 |
 |

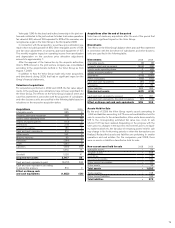
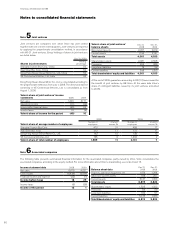
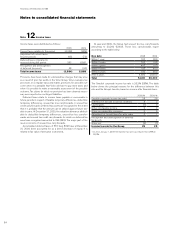
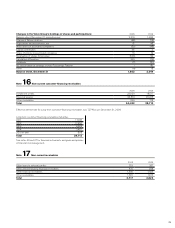
Notes to consolidated financial statements
Total shareholders’ equity
and liabilities 2008 2009
Operating liabilities, Industrial operations:1
Trucks 85,366 62,003
Construction Equipment 18,137 14,756
Buses 6,531 7,572
Volvo Penta 3,517 2,967
Volvo Aero 4,975 4,152
Other 869 400
Total operating liabilities
Industrial operations 119,395 91,850
Financial liabilities 58,426 8 6 , 911
Tax liabilities 8,242 2,861
Total liabilities in Customer Finance 108,052 90,223
Other and eliminations (6,336) (6,614)
Total liabilities 287,779 265,231
Shareholders’ equity 84,640 67,034
Volvo Group total 372,419 332,265
1 Defined as Total liabilities less Shareholders’ equity, Financial liabilities and
Tax liabilities.
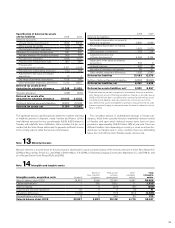
Investments in associated companies 2008 2009
Trucks 266 217
Construction Equipment – –
Buses 64 51
Volvo Penta – –
Volvo Aero 1 1
Customer Finance 18 19
Other 303 300
Volvo Group total 652 588
Capital expenditures 2008 2009
Trucks 7,998 7,272
Construction Equipment 2,503 1,307
Buses 386 639
Volvo Penta 656 687
Volvo Aero 1,304 533
Other 359 104
Industrial operations 13,206 10,542
Customer Finance1246 4,102
Eliminations 0(71)
Reclassification Group versus
segment Customer Finance 4,840 0
Volvo Group total 18,292 14,573
1 Volvo no longer reclassifies operating leases on a consolidated level to
finance leases. For further information see note 3 in the Annual report
for 2008.
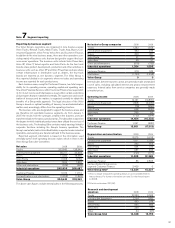
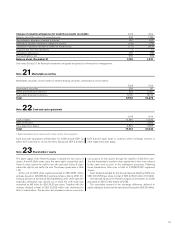
Reporting by geographical segment
Net sales 2008 2009
Europe 159,366 99,518
North America 48,670 40,223
South America 20,367 17,613
Asia 55,976 45,273
Other markets 20,263 15,734
Volvo Group total* 304,642 218,361
*of which:
Sweden 13,899 10,412
United States 36,799 31,243
France 33,815 25,344
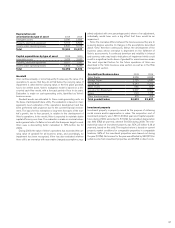
Total assets 2008 2009
Sweden 77,591 77,528
Europe excluding Sweden 129,325 105,265
North America 71,007 60,223
South America 15,704 20,322
Asia 70,439 60,286
Other markets 8,353 8,641
Volvo Group total 372,419 332,265
Capital expenditures 2008 2009
Sweden 5,358 3,924
Europe excluding Sweden 9,071 6,135
North America 2,147 2,622
South America 182 97
Asia 1,264 1, 574
Other markets 270 221
Volvo Group total 18,292 14,573
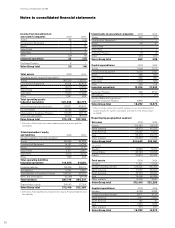
Income from investments in
associated companies 2008 2009
Trucks 40 (22)
Construction Equipment 0 0
Buses 812
Volvo Penta 0 0
Volvo Aero 0 0
Other (25) (5)
Industrial operations 23 (15)
Customer Finance 2 1
Volvo Group total 25 (14)
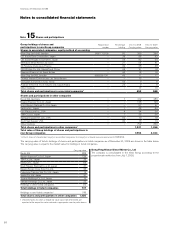
Total assets 2008 2009
Operating assets, Industrial operations1:
Trucks 140,225 112,157
Construction Equipment 47,914 40,454
Buses 12,073 12,462
Volvo Penta 6,222 5,444
Volvo Aero 11, 973 11, 3 2 6
Other 1,831 936
Total operating assets
Industrial operations 220,238 182,779
Interest-bearing financial assets 28,631 45,422
Tax receivables 12,725 13,639
Total assets in Customer Finance 117, 6 4 6 98,772
Other and eliminations (6,821) (8,347)
Volvo Group total 372,419 332,265
1 Defined as Total assets less Interest-bearing financial assets and Tax
receivables.
FINANCIAL INFORMATION 2009
82