Volvo 2009 Annual Report Download - page 114
Download and view the complete annual report
Please find page 114 of the 2009 Volvo annual report below. You can navigate through the pages in the report by either clicking on the pages listed below, or by using the keyword search tool below to find specific information within the annual report.-
 1
1 -
2
-
3
-
4
-
5
-
6
-
7
-
8
-
9
-
10
-
11
-
12
-
13
-
14
-
15
-
16
-
17
-
18
-
19
-
20
-
21
-
22
-
23
-
24
-
25
-
26
-
27
-
28
-
29
-
30
-
31
-
32
-
33
-
34
-
35
-
36
-
37
-
38
-
39
-
40
-
41
-
42
-
43
-
44
-
45
-
46
-
47
-
48
-
49
-
50
-
51
-
52
-
53
-
54
-
55
-
56
-
57
-
58
-
59
-
60
-
61
-
62
-
63
-
64
-
65
-
66
-
67
-
68
-
69
-
70
-
71
-
72
-
73
-
74
-
75
-
76
-
77
-
78
-
79
-
80
-
81
-
82
-
83
-
84
-
85
-
86
-
87
-
88
-
89
-
90
-
91
-
92
-
93
-
94
-
95
-
96
-
97
-
98
-
99
-
100
-
101
-
102
-
103
-
 104
104 -
 105
105 -
 106
106 -
 107
107 -
 108
108 -
 109
109 -
 110
110 -
 111
111 -
 112
112 -
 113
113 -
 114
114 -
 115
115 -
 116
116 -
 117
117 -
 118
118 -
 119
119 -
 120
120 -
 121
121 -
 122
122 -
 123
123 -
 124
124 -
125
-
126
-
127
-
128
-
129
-
130
-
131
-
132
-
133
-
134
-
135
-
136
-
137
-
138
-
139
-
140
-
141
-
142
-
143
-
144
-
145
-
146
 |
 |

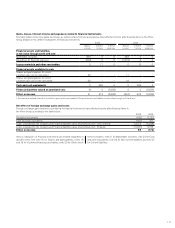
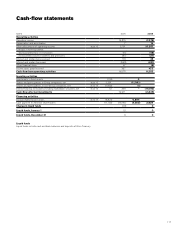
Notes to consolidated financial statements
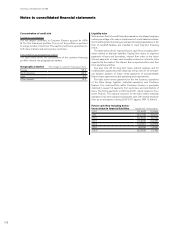
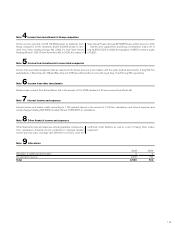
Derecognition of financial assets
Financial assets that have been transferred in such a way that part or
all of the financial assets do not qualify for derecognition, are included
in reported assets of the Volvo Group. In accordance with IAS 39
Financial Instruments, Recognition and Measurement, an evaluation
is made whether substantially all the risks and rewards have been
transferred to an external party. When Volvo has concluded that it is
not the case, the part of the financial assets that reflect Volvo’s con-
tinuous involvement are being recognized. On December 31, 2009,
Volvo recognizes SEK 2.2 (3.9) billion corresponding to Volvo’s con-
tinuous involvement, mostly within the customer financing operations.
Of this balance, SEK 2.1 (3.8) billion derives from credit guarantees
for customer finance receivables that Nissan Diesel has entered into.
A corresponding amount is reported as a financial liability.
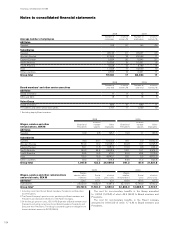
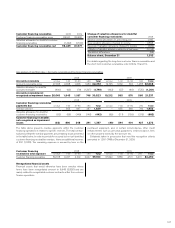
Financial assets and liabilities measured at Fair value
December 31, 2008 December 31, 2009
Assets Level 1 Level 2 Level 3 Total Level 1 Level 2 Level 3 Total
Financial assets
at fair value through profit and loss
Currency risk contracts
– commercial exposure –2,280 –2,280 –467 –467
Raw materials contracts –38 –38 –42 –42
Interest risk contracts
– financial exposure –4,510 –4,510 –3,848 –3,848
Marketable securities –5,902 –5,902 –16,676 –16,676
Available for sale financial assets
Shares and participations for which:
a market value can be calculated 661 – – 661 707 – – 707
Total 661 12,730 –13,391 707 21,033 –21,740
Liabilities
Financial liabilities
at fair value through profit and loss
Currency risk contracts
– commercial exposure –5,216 –5,216 –281 –281
Raw materials contracts –93 –93 –58 –58
Interest risk contracts
– financial exposure –2,978 –2,978 –3,285 –3,285
Total –8,287 –8,287 –3,624 –3,624
The levels in the table above reflect the significance of the inputs used
in making the measurements. Financial instruments in level 1 are valued
based on unadjusted quoted market prices for identical assets or
liabilities. Level 2 instruments are valued based on inputs, other than
quoted prices within level 1, that are observable either directly (as
prices) or indirectly (derived from prices). Level 3 instruments would
be valued based on unobservable inputs i.e. using a valuation tech-
nique based on assumptions. Volvo has no financial instruments clas-
sified as level 3 instruments.
FINANCIAL INFORMATION 2009
110