Volvo 2009 Annual Report Download - page 29
Download and view the complete annual report
Please find page 29 of the 2009 Volvo annual report below. You can navigate through the pages in the report by either clicking on the pages listed below, or by using the keyword search tool below to find specific information within the annual report.-
 1
1 -
2
-
3
-
4
-
5
-
6
-
7
-
8
-
9
-
10
-
11
-
12
-
13
-
14
-
15
-
16
-
17
-
18
-
 19
19 -
 20
20 -
 21
21 -
 22
22 -
 23
23 -
 24
24 -
 25
25 -
 26
26 -
 27
27 -
 28
28 -
 29
29 -
 30
30 -
 31
31 -
 32
32 -
 33
33 -
 34
34 -
 35
35 -
 36
36 -
 37
37 -
 38
38 -
 39
39 -
40
-
41
-
42
-
43
-
44
-
45
-
46
-
47
-
48
-
49
-
50
-
51
-
52
-
53
-
54
-
55
-
56
-
57
-
58
-
59
-
60
-
61
-
62
-
63
-
64
-
65
-
66
-
67
-
68
-
69
-
70
-
71
-
72
-
73
-
74
-
75
-
76
-
77
-
78
-
79
-
80
-
81
-
82
-
83
-
84
-
85
-
86
-
87
-
88
-
89
-
90
-
91
-
92
-
93
-
94
-
95
-
96
-
97
-
98
-
99
-
100
-
101
-
102
-
103
-
104
-
105
-
106
-
107
-
108
-
109
-
110
-
111
-
112
-
113
-
114
-
115
-
116
-
117
-
118
-
119
-
120
-
121
-
122
-
123
-
124
-
125
-
126
-
127
-
128
-
129
-
130
-
131
-
132
-
133
-
134
-
135
-
136
-
137
-
138
-
139
-
140
-
141
-
142
-
143
-
144
-
145
-
146
 |
 |

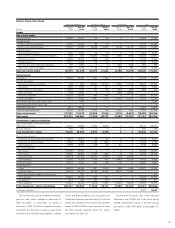
Income Statement Customer Finance
SEK M 2008 2009
Finance and lease income 11, 073 11,712
Finance and lease expenses (7,683) (8,427)
Gross income 3,390 3,285
Selling and administrative expenses (1,551) (1,608)
Credit provision expenses (483) (2,327)
Other operating income and expenses 41 (30)
Operating income 1,397 (680)
Income taxes (356) 114
Income for the period 1,041 (566)
Return on Equity 12.6 (6.2)
Operating net flow per currency1
SEK M 2008 2009
USD 23,600 14,000
EUR 15,700 6,300
GBP 7,700 4,000
CAD 1,900 1,300
Other currencies 12,200 6,200
Total 61,100 31,800
1 Operating net flow per currency are reported at average
spot rates.
Change in operating income
SEK bn 2009
Operating income 2008 15.9
Gross income (33.1)
Provisions for healthcare benets
according to agreement with United
Auto Workers, UAW (0.9)
Additional provisions for residual value
commitments (0.8)
Changes in currency exchange rates (1.9)
Higher capitalization of development
costs 1.1
Lower research and development
expenditures 0.6
Lower selling and administrative expenses 5.4
Write-down of assets held for sale (0.4)
Higher credit losses (2.2)
Other (0.7)
Operating income 2009 (17.0)
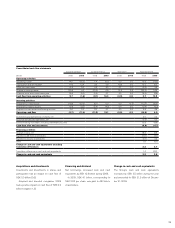
Key ratios
Financial Services 2008 2009
Credit portfolio net, SEK bn 112 . 3 93.5
Operating income, SEK M 1,397 (680)
Return on shareholders'
equity, % 12.6 (6.2)
Market penetration, % 24.9 24.8
Penetration by business area, %
Volvo CE 36 34
Volvo Trucks 29 30
Renualt Trucks 18 20
Mack Trucks 16 14
Buses 14 16
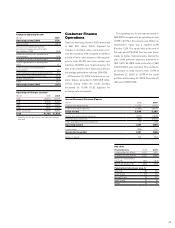
Customer Finance
Operations
Total new nancing volume in 2009 amounted
to SEK 28.7 billion (44.5). Adjusted for
changes in exchange rates, new business vol-
ume decreased by 41% compared to 2008 as
a result of lower sales volumes of Group prod-
ucts. In total, 25,782 new Volvo vehicles and
machines (47,986) were nanced during the
year. In the markets where nancing is offered,
the average penetration rate was 25% (25).
At December 31, 2009 total assets in cus-
tomer nance amounted to SEK 98.8 billion
(117.6). During 2009 the credit portfolio
decreased by 15.6% (11.8), adjusted for
exchange-rate movements.
The operating loss for the year amounted to
SEK 680 M compared to an operating income
of SEK 1,397 M in the previous year. Return on
shareholders’ equity was a negative 6.2%
(Positive 12.6). The equity ratio at the end of
the year was 8.7% (8.2). The loss was driven
mainly by higher credit provisions. During the
year, credit provision expenses amounted to
SEK 2,327 M (483) while write-offs of SEK
2,223 M (521) were recorded. This resulted in
an increase in credit reserves from 1.37% at
December 31, 2008 to 1.67% of the credit
portfolio at December 31, 2009. The write-off
ratio was 2.09% (0.54).
25